Now Available: The Opportunity Zones Playbook
Now Available: The Opportunity Zones Playbook
South Carolina has 135 Qualified Opportunity Zones, including 95 rural Opportunity Zones. These OZ 1.0 zones remain in effect through December 31, 2028. In the second half of 2026, South Carolina will nominate approximately 112 new Opportunity Zones under the OZ 2.0 framework, with those designations taking effect on January 1, 2027.
Jump to section:
- South Carolina Opportunity Zones Map
- Current Opportunity Zones in South Carolina (Designated in 2018)
- South Carolina Census Tracts Eligible For Future OZ 2.0 Designation
Official State Resources: South Carolina Governor’s Office
What Are Opportunity Zones?
Opportunity Zones are economically distressed communities designated at the census tract level. U.S. taxpayers who reinvest eligible capital gains into Qualified Opportunity Funds that invest in Opportunity Zone property may qualify for several federal tax benefits.
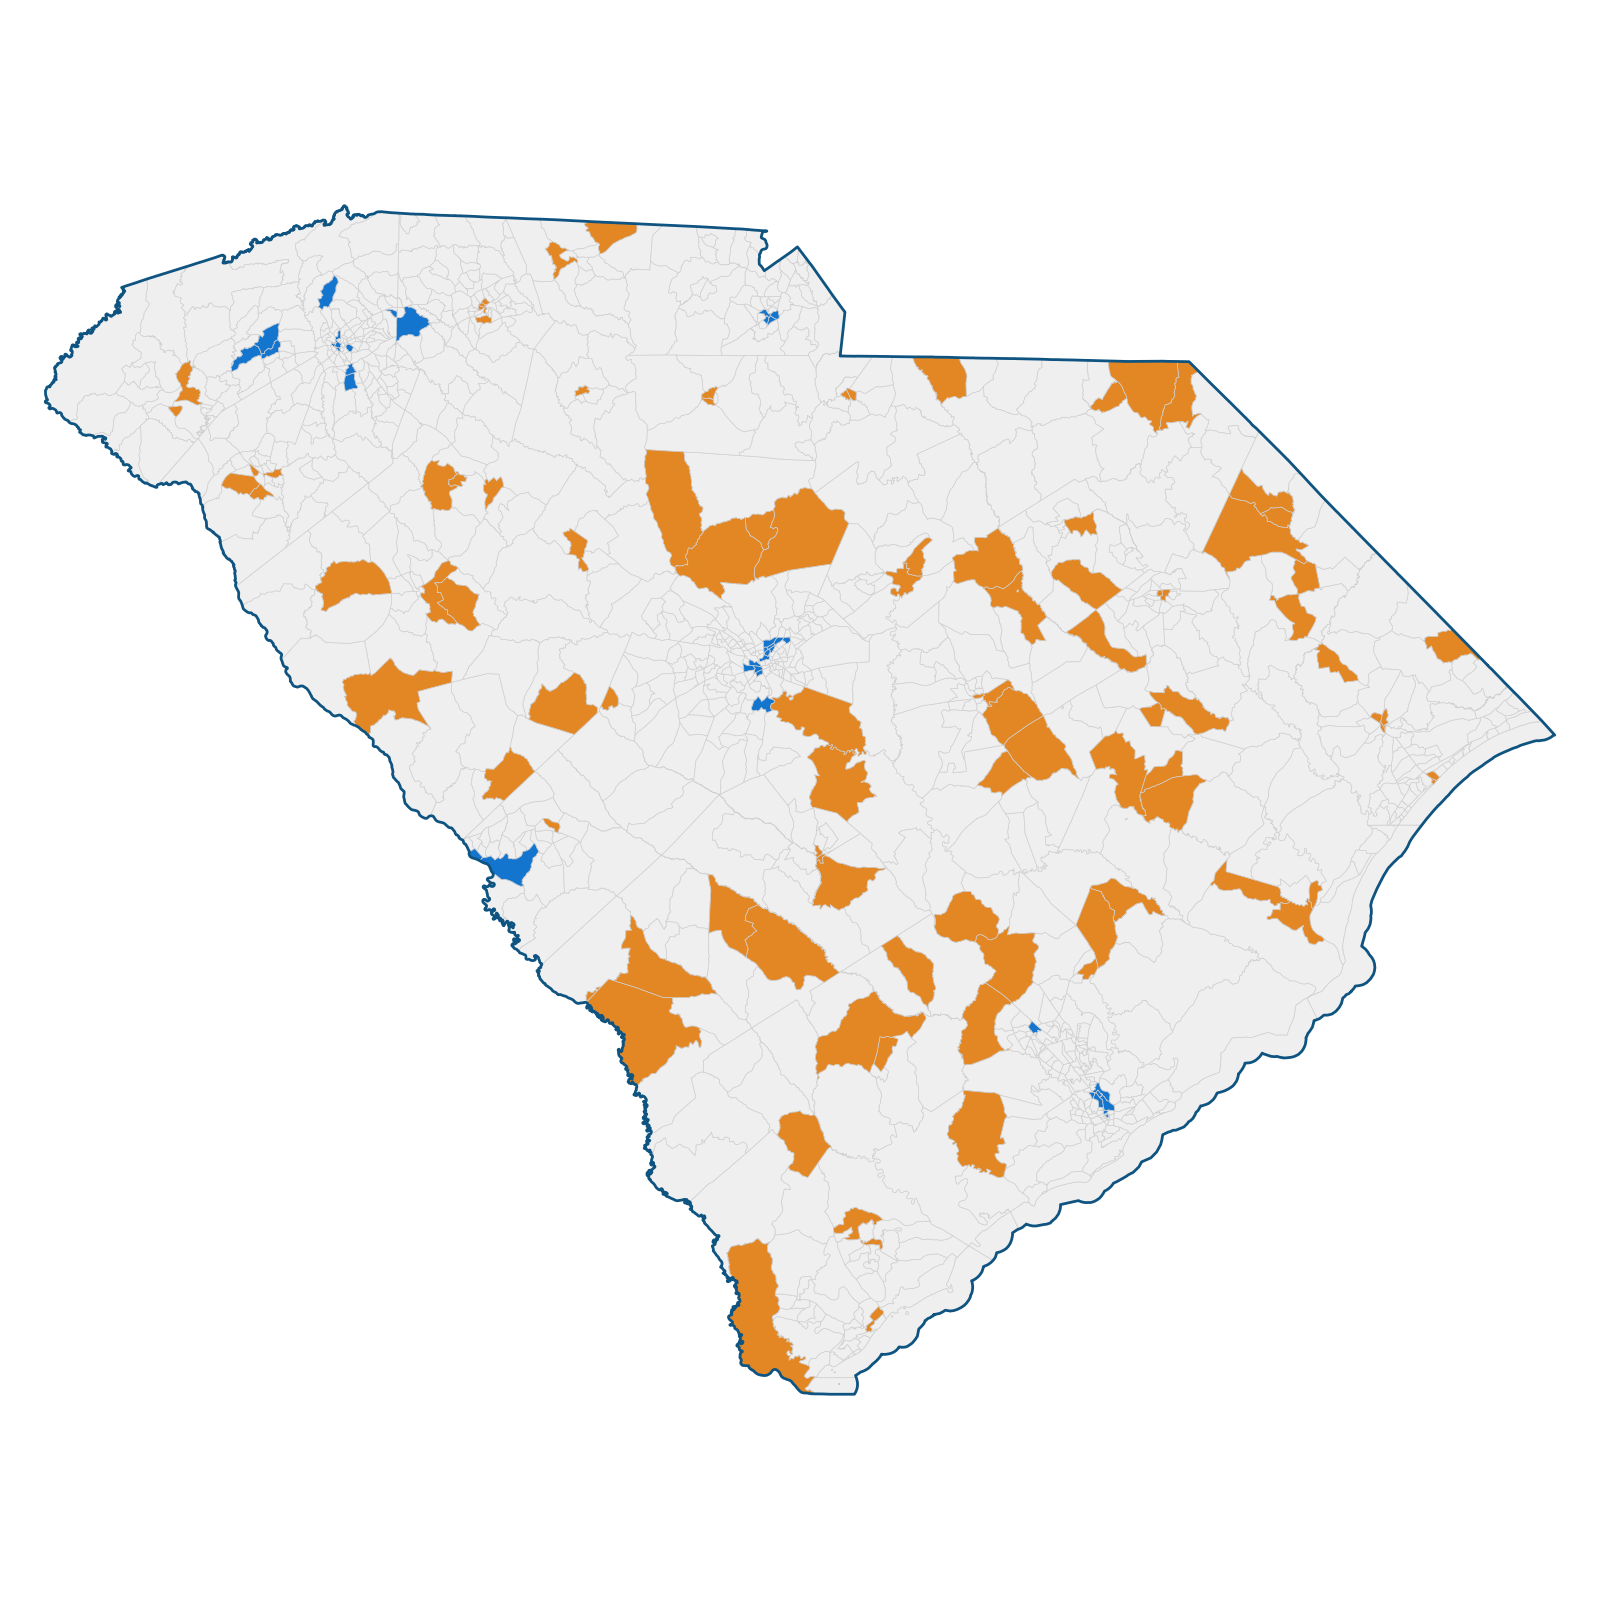
South Carolina Opportunity Zones Map
The image below shows all of the Opportunity Zones in South Carolina. Blue shaded census tracts are non-rural Opportunity Zones. Orange shaded census tracts are rural Opportunity Zones. For a searchable interactive version, go to our Opportunity Zones Map.
Current Opportunity Zones in South Carolina (Designated in 2018)
The table below lists all South Carolina Opportunity Zones by county, as designated under IRS Notice 2018-48. These census tracts were designated in 2018 as part of the OZ 1.0 designation round and correspond to 2010 U.S. Census tract boundaries. Rural determinations were issued in 2025 pursuant to IRS Notice 2025-50. All such OZ 1.0 designations expire after December 31, 2028.
To view these on a map, go to our Opportunity Zones Map.
| County | Census Tract | Type |
|---|---|---|
| Abbeville | 45001950400 | Rural |
| Aiken | 45003020802 | Non-Rural |
| Aiken | 45003020902 | Non-Rural |
| Aiken | 45003021400 | Rural |
| Allendale | 45005970200 | Rural |
| Anderson | 45007000800 | Rural |
| Anderson | 45007011901 | Rural |
| Anderson | 45007012002 | Rural |
| Anderson | 45007012300 | Rural |
| Bamberg | 45009960100 | Rural |
| Bamberg | 45009960200 | Rural |
| Barnwell | 45011970500 | Rural |
| Beaufort | 45013000200 | Rural |
| Beaufort | 45013000600 | Rural |
| Beaufort | 45013010800 | Rural |
| Berkeley | 45015020102 | Rural |
| Berkeley | 45015020201 | Rural |
| Berkeley | 45015020302 | Rural |
| Berkeley | 45015020506 | Rural |
| Calhoun | 45017950200 | Rural |
| Charleston | 45019000700 | Non-Rural |
| Charleston | 45019002400 | Rural |
| Charleston | 45019004000 | Non-Rural |
| Charleston | 45019004300 | Non-Rural |
| Charleston | 45019004400 | Non-Rural |
| Charleston | 45019005300 | Non-Rural |
| Charleston | 45019005400 | Non-Rural |
| Charleston | 45019005500 | Non-Rural |
| Cherokee | 45021970201 | Rural |
| Cherokee | 45021970401 | Rural |
| Chester | 45023020200 | Rural |
| Chester | 45023020300 | Rural |
| Chesterfield | 45025950101 | Rural |
| Chesterfield | 45025950502 | Rural |
| Clarendon | 45027960300 | Rural |
| Clarendon | 45027960500 | Rural |
| Colleton | 45029970401 | Rural |
| Colleton | 45029970402 | Rural |
| Darlington | 45031010600 | Rural |
| Darlington | 45031011500 | Rural |
| Dillon | 45033970300 | Rural |
| Dillon | 45033970400 | Rural |
| Dillon | 45033970600 | Rural |
| Dorchester | 45035010200 | Rural |
| Dorchester | 45035010400 | Rural |
| Dorchester | 45035010700 | Non-Rural |
| Edgefield | 45037970400 | Rural |
| Fairfield | 45039960100 | Rural |
| Fairfield | 45039960300 | Rural |
| Fairfield | 45039960400 | Rural |
| Fairfield | 45039960500 | Rural |
| Florence | 45041000700 | Rural |
| Florence | 45041001000 | Rural |
| Florence | 45041002000 | Rural |
| Florence | 45041002201 | Rural |
| Florence | 45041002500 | Rural |
| Georgetown | 45043920201 | Rural |
| Georgetown | 45043920302 | Rural |
| Georgetown | 45043920700 | Rural |
| Greenville | 45045000500 | Non-Rural |
| Greenville | 45045000700 | Non-Rural |
| Greenville | 45045000800 | Non-Rural |
| Greenville | 45045002005 | Non-Rural |
| Greenville | 45045002303 | Non-Rural |
| Greenville | 45045002505 | Non-Rural |
| Greenville | 45045003401 | Non-Rural |
| Greenville | 45045003904 | Non-Rural |
| Greenville | 45045004300 | Non-Rural |
| Greenwood | 45047970600 | Rural |
| Greenwood | 45047970702 | Rural |
| Hampton | 45049920300 | Rural |
| Horry | 45051020200 | Rural |
| Horry | 45051050600 | Rural |
| Horry | 45051050700 | Rural |
| Horry | 45051070200 | Rural |
| Horry | 45051070300 | Rural |
| Horry | 45051080102 | Rural |
| Jasper | 45053950300 | Rural |
| Kershaw | 45055970601 | Rural |
| Kershaw | 45055970800 | Rural |
| Lancaster | 45057010700 | Rural |
| Lancaster | 45057010800 | Rural |
| Laurens | 45059920301 | Rural |
| Laurens | 45059920400 | Rural |
| Laurens | 45059920700 | Rural |
| Lee | 45061920200 | Rural |
| Lee | 45061920302 | Rural |
| Lexington | 45063020201 | Non-Rural |
| Lexington | 45063020300 | Non-Rural |
| Lexington | 45063020505 | Non-Rural |
| Lexington | 45063020509 | Non-Rural |
| Lexington | 45063020706 | Non-Rural |
| Lexington | 45063021402 | Rural |
| McCormick | 45065920200 | Rural |
| Marion | 45067950300 | Rural |
| Marion | 45067950600 | Rural |
| Marlboro | 45069960100 | Rural |
| Marlboro | 45069960302 | Rural |
| Newberry | 45071950502 | Rural |
| Oconee | 45073030602 | Rural |
| Oconee | 45073030701 | Rural |
| Orangeburg | 45075010200 | Rural |
| Orangeburg | 45075010600 | Rural |
| Orangeburg | 45075011300 | Rural |
| Orangeburg | 45075011400 | Rural |
| Pickens | 45077010700 | Non-Rural |
| Pickens | 45077010801 | Non-Rural |
| Pickens | 45077011001 | Non-Rural |
| Richland | 45079000100 | Non-Rural |
| Richland | 45079000200 | Non-Rural |
| Richland | 45079000500 | Non-Rural |
| Richland | 45079000700 | Non-Rural |
| Richland | 45079010600 | Non-Rural |
| Richland | 45079010703 | Non-Rural |
| Richland | 45079010803 | Non-Rural |
| Richland | 45079010900 | Non-Rural |
| Richland | 45079011800 | Rural |
| Saluda | 45081960400 | Rural |
| Spartanburg | 45083020301 | Rural |
| Spartanburg | 45083020400 | Rural |
| Spartanburg | 45083020500 | Rural |
| Spartanburg | 45083020702 | Rural |
| Spartanburg | 45083020800 | Rural |
| Spartanburg | 45083023202 | Non-Rural |
| Sumter | 45085000600 | Rural |
| Sumter | 45085001100 | Rural |
| Sumter | 45085001300 | Rural |
| Union | 45087030100 | Rural |
| Williamsburg | 45089970501 | Rural |
| Williamsburg | 45089970502 | Rural |
| Williamsburg | 45089970600 | Rural |
| York | 45091060200 | Non-Rural |
| York | 45091060300 | Non-Rural |
| York | 45091060401 | Non-Rural |
| York | 45091060501 | Non-Rural |
South Carolina Census Tracts Eligible For Future OZ 2.0 Designation
On January 29, 2026, the U.S. Census Bureau published its five-year American Community Survey (ACS) estimates for the 2020–2024 period, providing the income and poverty data that define which census tracts are eligible for Opportunity Zone designation in 2026.
According to OpportunityZones.com analysis of this data, South Carolina has 445 census tracts that meet the median family income and/or poverty rate requirements for OZ 2.0 tract eligibility. Per the 25% statutory cap, South Carolina will be able to nominate 112 of their 445 eligible tracts as Opportunity Zones.
The nomination window for each state opens on July 1, 2026 and runs for a period of up to 120 days. Upon receiving each state’s nominations, the U.S. Department of the Treasury then has up to 60 days to officially designate the state’s nominated census tracts as Opportunity Zones. The new OZ 2.0 tracts will take effect on January 1, 2027.
Note: The table below lists all OZ 2.0 eligible tracts in the state of South Carolina. This is not the final list of designated tracts. The final list will be published here in late 2026. These census tracts correspond to the tract boundaries of the 2020 U.S. Census.
To view these OZ 2.0 eligible tracts on a map, go to our OZ 2.0 Eligibility Map.
| County | Census Tract | MFI Ratio | Poverty |
|---|---|---|---|
| Abbeville | 45001950500 | 79.56% | 21.90% |
| Aiken | 45003020100 | 64.81% | 28.94% |
| Aiken | 45003020200 | 65.98% | 13.96% |
| Aiken | 45003020301 | 91.46% | 22.31% |
| Aiken | 45003020402 | 69.16% | 39.16% |
| Aiken | 45003020603 | 60.85% | 19.92% |
| Aiken | 45003020702 | 51.40% | 24.84% |
| Aiken | 45003021001 | 80.30% | 21.16% |
| Aiken | 45003021003 | 71.13% | 23.00% |
| Aiken | 45003021004 | 60.28% | 12.70% |
| Aiken | 45003021101 | 84.49% | 22.03% |
| Aiken | 45003021401 | 70.33% | 33.59% |
| Aiken | 45003021402 | 54.18% | 36.50% |
| Aiken | 45003021601 | 91.08% | 29.78% |
| Aiken | 45003021800 | 55.97% | 19.51% |
| Aiken | 45003021901 | 65.64% | 31.22% |
| Aiken | 45003021902 | 69.16% | 8.92% |
| Aiken | 45003022001 | 77.16% | 26.35% |
| Allendale | 45005970201 | – | 43.33% |
| Allendale | 45005970202 | 61.99% | 22.65% |
| Allendale | 45005970500 | 64.11% | 21.00% |
| Anderson | 45007000500 | 74.47% | 22.01% |
| Anderson | 45007000600 | 36.56% | 46.65% |
| Anderson | 45007000701 | 36.58% | 38.74% |
| Anderson | 45007000702 | 34.86% | 40.33% |
| Anderson | 45007000800 | – | 30.39% |
| Anderson | 45007001000 | 52.13% | 17.51% |
| Anderson | 45007010105 | 66.69% | 3.50% |
| Anderson | 45007010403 | 89.29% | 21.04% |
| Anderson | 45007010405 | 69.65% | 14.14% |
| Anderson | 45007010701 | 113.24% | 20.32% |
| Anderson | 45007011402 | 53.00% | 21.03% |
| Anderson | 45007011502 | 46.02% | 30.88% |
| Anderson | 45007011701 | 60.02% | 10.52% |
| Anderson | 45007011702 | 67.69% | 22.63% |
| Anderson | 45007011800 | 71.15% | 25.98% |
| Anderson | 45007011901 | 48.36% | 34.15% |
| Anderson | 45007011902 | 76.73% | 28.98% |
| Anderson | 45007012300 | 52.71% | 30.74% |
| Bamberg | 45009960102 | 53.04% | 29.31% |
| Bamberg | 45009960201 | 92.57% | 20.03% |
| Bamberg | 45009960202 | 62.87% | 35.02% |
| Bamberg | 45009960300 | 66.37% | 20.26% |
| Bamberg | 45009960400 | 60.55% | 13.78% |
| Barnwell | 45011970101 | 56.22% | 25.09% |
| Barnwell | 45011970102 | 69.87% | 25.08% |
| Barnwell | 45011970200 | 62.18% | 28.43% |
| Barnwell | 45011970300 | 64.85% | 26.00% |
| Barnwell | 45011970401 | 89.79% | 21.51% |
| Barnwell | 45011970500 | 74.79% | 30.41% |
| Beaufort | 45013000100 | 73.20% | 22.65% |
| Beaufort | 45013000200 | 68.80% | 24.74% |
| Beaufort | 45013000300 | 61.90% | 11.95% |
| Beaufort | 45013000400 | 16.47% | 64.29% |
| Beaufort | 45013000600 | 45.47% | 28.87% |
| Beaufort | 45013001000 | 63.95% | 0.00% |
| Beaufort | 45013001104 | 66.52% | 36.46% |
| Beaufort | 45013010800 | 50.02% | 21.58% |
| Beaufort | 45013011300 | 79.52% | 20.47% |
| Berkeley | 45015020101 | 52.57% | 12.53% |
| Berkeley | 45015020201 | 66.69% | 32.68% |
| Berkeley | 45015020202 | 32.45% | 21.02% |
| Berkeley | 45015020303 | 64.37% | 13.60% |
| Berkeley | 45015020401 | 58.52% | 12.31% |
| Berkeley | 45015020504 | 69.52% | 13.19% |
| Berkeley | 45015020506 | 69.55% | 11.17% |
| Berkeley | 45015020712 | 69.51% | 16.96% |
| Berkeley | 45015020715 | 79.32% | 20.74% |
| Berkeley | 45015020717 | 56.94% | 24.03% |
| Berkeley | 45015020725 | 50.31% | 9.49% |
| Berkeley | 45015020804 | 60.96% | 7.63% |
| Berkeley | 45015020811 | 64.29% | 6.99% |
| Berkeley | 45015020901 | 67.62% | 6.59% |
| Berkeley | 45015021000 | 70.36% | 21.16% |
| Charleston | 45019000700 | 84.97% | 41.93% |
| Charleston | 45019002402 | 69.17% | 18.67% |
| Charleston | 45019002503 | – | 26.59% |
| Charleston | 45019002614 | 64.97% | 12.09% |
| Charleston | 45019002702 | 72.72% | 22.78% |
| Charleston | 45019003104 | 37.28% | 23.21% |
| Charleston | 45019003105 | 56.13% | 17.24% |
| Charleston | 45019003107 | 60.88% | 8.36% |
| Charleston | 45019003115 | 50.44% | 33.55% |
| Charleston | 45019003117 | 69.42% | 11.62% |
| Charleston | 45019003200 | 62.46% | 11.12% |
| Charleston | 45019003300 | 55.16% | 29.85% |
| Charleston | 45019003400 | 63.06% | 25.86% |
| Charleston | 45019003700 | 55.21% | 11.20% |
| Charleston | 45019003800 | 69.69% | 10.51% |
| Charleston | 45019003900 | 55.70% | 14.34% |
| Charleston | 45019004000 | 60.70% | 35.05% |
| Charleston | 45019004300 | 28.81% | 27.12% |
| Charleston | 45019004400 | 77.85% | 25.10% |
| Charleston | 45019005300 | 62.18% | 33.85% |
| Charleston | 45019005400 | 35.03% | 22.00% |
| Charleston | 45019005500 | 40.84% | 39.61% |
| Cherokee | 45021970201 | 67.74% | 24.06% |
| Cherokee | 45021970301 | 67.93% | 11.05% |
| Cherokee | 45021970302 | 44.11% | 41.86% |
| Cherokee | 45021970401 | 66.03% | 21.62% |
| Cherokee | 45021970502 | 36.72% | 44.82% |
| Cherokee | 45021970601 | 74.51% | 21.51% |
| Chester | 45023020100 | 54.65% | 24.13% |
| Chester | 45023020300 | 45.19% | 35.16% |
| Chester | 45023020400 | 61.03% | 14.68% |
| Chester | 45023020500 | 60.52% | 21.06% |
| Chester | 45023020601 | 57.85% | 10.51% |
| Chester | 45023020602 | 65.72% | 19.72% |
| Chester | 45023020700 | 55.30% | 20.90% |
| Chester | 45023020800 | 65.72% | 9.30% |
| Chester | 45023020900 | 61.00% | 17.55% |
| Chester | 45023021000 | 55.71% | 28.62% |
| Chesterfield | 45025950102 | 57.07% | 35.31% |
| Chesterfield | 45025950300 | 58.31% | 11.02% |
| Chesterfield | 45025950401 | 65.41% | 14.23% |
| Chesterfield | 45025950402 | 65.76% | 17.20% |
| Chesterfield | 45025950503 | 57.61% | 22.78% |
| Chesterfield | 45025950504 | 73.52% | 23.78% |
| Chesterfield | 45025950601 | 96.73% | 27.23% |
| Chesterfield | 45025950602 | 76.41% | 36.93% |
| Chesterfield | 45025950701 | 112.58% | 29.21% |
| Chesterfield | 45025950800 | 68.66% | 10.53% |
| Clarendon | 45027960500 | 49.17% | 30.74% |
| Clarendon | 45027960600 | 68.98% | 7.13% |
| Colleton | 45029970100 | 85.76% | 25.28% |
| Colleton | 45029970301 | 39.53% | 30.03% |
| Colleton | 45029970401 | 42.43% | 25.19% |
| Colleton | 45029970501 | 65.75% | 33.79% |
| Colleton | 45029970601 | 56.89% | 29.14% |
| Darlington | 45031010100 | 90.49% | 24.68% |
| Darlington | 45031010200 | 92.57% | 21.48% |
| Darlington | 45031010300 | 120.59% | 28.27% |
| Darlington | 45031010600 | 52.96% | 33.22% |
| Darlington | 45031010700 | 36.56% | 45.31% |
| Darlington | 45031010800 | 93.69% | 21.25% |
| Darlington | 45031011100 | 89.77% | 23.29% |
| Darlington | 45031011201 | 48.27% | 39.98% |
| Darlington | 45031011202 | 51.54% | 20.04% |
| Darlington | 45031011301 | 76.12% | 20.16% |
| Darlington | 45031011400 | 70.25% | 21.07% |
| Darlington | 45031011500 | 99.68% | 20.61% |
| Darlington | 45031011600 | 69.73% | 26.17% |
| Dillon | 45033970100 | 52.89% | 27.05% |
| Dillon | 45033970200 | 59.89% | 19.60% |
| Dillon | 45033970302 | 35.78% | 39.36% |
| Dillon | 45033970401 | – | 42.21% |
| Dillon | 45033970402 | 57.67% | 25.18% |
| Dillon | 45033970500 | 64.70% | 27.98% |
| Dillon | 45033970601 | 76.50% | 27.04% |
| Dillon | 45033970602 | 64.66% | 29.97% |
| Dorchester | 45035010100 | 61.79% | 17.09% |
| Dorchester | 45035010200 | 45.96% | 33.46% |
| Dorchester | 45035010301 | 60.90% | 16.89% |
| Dorchester | 45035010302 | 63.81% | 4.66% |
| Dorchester | 45035010501 | 68.36% | 15.36% |
| Dorchester | 45035010607 | 51.96% | 8.67% |
| Dorchester | 45035010813 | 66.66% | 28.79% |
| Dorchester | 45035010815 | 53.97% | 10.38% |
| Edgefield | 45037970204 | 49.85% | 32.38% |
| Edgefield | 45037970300 | 75.67% | 28.90% |
| Edgefield | 45037970501 | 87.98% | 22.52% |
| Fairfield | 45039960401 | 42.98% | 16.46% |
| Fairfield | 45039960402 | 57.55% | 37.99% |
| Fairfield | 45039960502 | 84.17% | 21.90% |
| Florence | 45041000400 | 89.33% | 22.15% |
| Florence | 45041000502 | 80.44% | 25.73% |
| Florence | 45041000700 | 41.89% | 59.11% |
| Florence | 45041000800 | 54.33% | 21.60% |
| Florence | 45041000900 | 55.41% | 42.70% |
| Florence | 45041001000 | 46.73% | 37.18% |
| Florence | 45041001601 | 113.83% | 20.45% |
| Florence | 45041001700 | 58.32% | 23.40% |
| Florence | 45041001800 | 89.53% | 26.77% |
| Florence | 45041001902 | 55.29% | 48.47% |
| Florence | 45041002000 | 118.58% | 23.23% |
| Florence | 45041002202 | 58.16% | 15.57% |
| Florence | 45041002204 | 100.59% | 36.70% |
| Florence | 45041002300 | 85.27% | 29.01% |
| Florence | 45041002600 | 94.52% | 26.55% |
| Georgetown | 45043920202 | 74.58% | 25.72% |
| Georgetown | 45043920204 | 71.46% | 33.56% |
| Georgetown | 45043920301 | 62.04% | 17.69% |
| Georgetown | 45043920601 | 66.97% | 32.65% |
| Georgetown | 45043920602 | 62.22% | 14.29% |
| Georgetown | 45043920800 | 65.70% | 34.80% |
| Greenville | 45045000500 | 114.68% | 27.58% |
| Greenville | 45045000800 | 64.81% | 25.14% |
| Greenville | 45045000900 | 79.99% | 30.54% |
| Greenville | 45045001502 | 36.13% | 27.50% |
| Greenville | 45045002001 | 43.98% | 27.56% |
| Greenville | 45045002003 | 56.67% | 42.30% |
| Greenville | 45045002005 | 60.87% | 15.90% |
| Greenville | 45045002104 | 77.05% | 21.82% |
| Greenville | 45045002105 | 46.62% | 28.58% |
| Greenville | 45045002106 | 60.11% | 20.66% |
| Greenville | 45045002107 | 50.50% | 18.48% |
| Greenville | 45045002108 | 78.17% | 20.07% |
| Greenville | 45045002202 | 43.50% | 20.87% |
| Greenville | 45045002203 | – | 39.37% |
| Greenville | 45045002204 | 43.02% | 40.26% |
| Greenville | 45045002302 | 55.08% | 15.32% |
| Greenville | 45045002303 | 53.42% | 42.65% |
| Greenville | 45045002304 | 124.07% | 21.78% |
| Greenville | 45045002504 | 67.63% | 20.95% |
| Greenville | 45045002505 | 48.63% | 31.55% |
| Greenville | 45045002820 | 110.83% | 20.18% |
| Greenville | 45045003202 | 76.10% | 25.85% |
| Greenville | 45045003401 | 55.95% | 16.75% |
| Greenville | 45045003500 | 71.15% | 26.50% |
| Greenville | 45045003602 | 58.53% | 22.49% |
| Greenville | 45045003704 | 51.08% | 38.61% |
| Greenville | 45045003705 | 65.65% | 33.27% |
| Greenville | 45045003706 | 65.28% | 12.74% |
| Greenville | 45045003906 | 117.01% | 27.22% |
| Greenville | 45045004101 | 59.31% | 23.62% |
| Greenville | 45045004300 | 70.67% | 27.67% |
| Greenville | 45045004400 | 54.05% | 30.08% |
| Greenwood | 45047970102 | 73.04% | 23.00% |
| Greenwood | 45047970401 | 69.20% | 24.71% |
| Greenwood | 45047970500 | 36.03% | 39.40% |
| Greenwood | 45047970801 | 56.13% | 22.76% |
| Greenwood | 45047970802 | 59.07% | 14.70% |
| Greenwood | 45047970900 | 67.86% | 9.23% |
| Hampton | 45049920100 | 81.03% | 22.44% |
| Hampton | 45049920201 | 63.40% | 27.08% |
| Hampton | 45049920202 | 60.47% | 13.95% |
| Hampton | 45049920300 | 80.42% | 28.47% |
| Hampton | 45049920401 | 49.38% | 19.25% |
| Horry | 45051010100 | 87.72% | 30.94% |
| Horry | 45051020100 | 59.24% | 20.05% |
| Horry | 45051020202 | 63.65% | 18.65% |
| Horry | 45051020301 | 86.11% | 21.40% |
| Horry | 45051020302 | 69.63% | 8.93% |
| Horry | 45051050500 | 65.45% | 25.38% |
| Horry | 45051050600 | 35.00% | 40.57% |
| Horry | 45051050700 | – | 49.36% |
| Horry | 45051050901 | 57.82% | 24.20% |
| Horry | 45051050902 | 46.66% | 29.93% |
| Horry | 45051051202 | 88.06% | 20.75% |
| Horry | 45051051406 | 85.10% | 24.87% |
| Horry | 45051051700 | 65.74% | 7.24% |
| Horry | 45051060101 | 98.76% | 26.80% |
| Horry | 45051060403 | 73.68% | 20.71% |
| Horry | 45051060405 | 102.66% | 29.08% |
| Horry | 45051070200 | 109.14% | 23.97% |
| Horry | 45051070300 | 115.98% | 20.46% |
| Horry | 45051070400 | 56.08% | 29.39% |
| Jasper | 45053950100 | 80.40% | 27.91% |
| Jasper | 45053950203 | 48.37% | 14.69% |
| Jasper | 45053950204 | 65.54% | 23.97% |
| Jasper | 45053950301 | 78.22% | 25.27% |
| Kershaw | 45055970100 | 65.47% | 16.91% |
| Kershaw | 45055970200 | 72.75% | 20.85% |
| Kershaw | 45055970700 | 81.71% | 32.60% |
| Kershaw | 45055970902 | 62.92% | 21.87% |
| Lancaster | 45057010202 | 64.57% | 8.75% |
| Lancaster | 45057010300 | 56.54% | 20.24% |
| Lancaster | 45057010500 | 42.32% | 35.65% |
| Lancaster | 45057010700 | 41.34% | 27.75% |
| Lancaster | 45057010800 | 52.20% | 18.84% |
| Lancaster | 45057011001 | 66.45% | 17.49% |
| Laurens | 45059920106 | 69.48% | 24.57% |
| Laurens | 45059920107 | 55.63% | 31.38% |
| Laurens | 45059920302 | 60.53% | 30.99% |
| Laurens | 45059920503 | 59.72% | 17.31% |
| Laurens | 45059920504 | 90.79% | 23.24% |
| Laurens | 45059920600 | 47.06% | 44.03% |
| Lee | 45061920201 | 98.19% | 25.03% |
| Lee | 45061920202 | 53.83% | 15.54% |
| Lee | 45061920302 | 54.45% | 35.95% |
| Lee | 45061920401 | 53.60% | 33.38% |
| Lee | 45061920600 | 40.78% | 41.53% |
| Lexington | 45063020100 | 55.90% | 24.37% |
| Lexington | 45063020300 | 70.13% | 20.77% |
| Lexington | 45063020510 | 60.58% | 18.73% |
| Lexington | 45063020513 | 82.38% | 23.15% |
| Lexington | 45063020803 | 72.55% | 20.85% |
| Lexington | 45063020804 | 51.35% | 25.82% |
| Lexington | 45063020807 | 45.26% | 26.62% |
| Lexington | 45063020905 | 75.37% | 29.57% |
| Lexington | 45063020906 | 76.57% | 23.32% |
| Lexington | 45063020909 | 84.01% | 28.60% |
| Lexington | 45063020910 | 69.63% | 19.37% |
| Lexington | 45063021051 | 71.30% | 24.05% |
| Lexington | 45063021311 | 91.41% | 20.35% |
| Lexington | 45063021402 | 68.11% | 12.17% |
| Lexington | 45063021403 | 55.29% | 19.79% |
| McCormick | 45065920300 | 88.95% | 23.69% |
| Marion | 45067950100 | 58.09% | 22.90% |
| Marion | 45067950200 | 56.74% | 26.33% |
| Marion | 45067950300 | 76.56% | 23.37% |
| Marion | 45067950400 | 39.40% | 38.05% |
| Marion | 45067950500 | 77.20% | 21.85% |
| Marion | 45067950600 | 37.87% | 35.59% |
| Marion | 45067950700 | 41.45% | 41.73% |
| Marion | 45067950800 | 71.68% | 38.39% |
| Marlboro | 45069960100 | 64.08% | 26.85% |
| Marlboro | 45069960201 | 95.09% | 30.87% |
| Marlboro | 45069960202 | 84.40% | 28.02% |
| Marlboro | 45069960301 | 57.12% | 25.93% |
| Marlboro | 45069960302 | 75.69% | 30.49% |
| Marlboro | 45069960400 | 48.04% | 30.64% |
| Marlboro | 45069960500 | 54.96% | 27.38% |
| Marlboro | 45069960600 | 64.95% | 25.28% |
| Newberry | 45071950201 | 88.83% | 30.44% |
| Newberry | 45071950203 | 93.50% | 32.15% |
| Newberry | 45071950300 | 71.70% | 22.98% |
| Newberry | 45071950502 | 63.16% | 27.48% |
| Oconee | 45073030100 | 71.72% | 26.53% |
| Oconee | 45073030201 | 75.30% | 21.28% |
| Oconee | 45073030403 | 71.20% | 22.91% |
| Oconee | 45073030404 | 52.77% | 36.65% |
| Oconee | 45073030701 | 95.02% | 23.06% |
| Oconee | 45073030801 | 67.13% | 29.97% |
| Oconee | 45073030802 | 64.87% | 20.75% |
| Oconee | 45073031100 | 77.49% | 24.96% |
| Orangeburg | 45075010101 | 51.44% | 36.83% |
| Orangeburg | 45075010102 | 89.99% | 27.34% |
| Orangeburg | 45075010104 | 50.46% | 31.12% |
| Orangeburg | 45075010200 | 56.54% | 27.38% |
| Orangeburg | 45075010302 | 60.39% | 20.89% |
| Orangeburg | 45075010303 | – | 36.96% |
| Orangeburg | 45075010400 | 63.06% | 17.41% |
| Orangeburg | 45075010500 | 79.82% | 20.40% |
| Orangeburg | 45075010602 | 37.31% | 69.14% |
| Orangeburg | 45075010604 | 87.22% | 33.95% |
| Orangeburg | 45075010700 | 57.29% | 23.48% |
| Orangeburg | 45075010801 | – | 56.03% |
| Orangeburg | 45075011000 | 50.16% | 27.38% |
| Orangeburg | 45075011100 | 64.68% | 33.88% |
| Orangeburg | 45075011300 | 32.46% | 63.97% |
| Orangeburg | 45075011400 | 46.54% | 33.50% |
| Orangeburg | 45075011500 | 79.93% | 24.05% |
| Orangeburg | 45075011600 | 72.76% | 24.24% |
| Orangeburg | 45075011704 | 54.60% | 20.13% |
| Orangeburg | 45075011802 | 54.70% | 19.91% |
| Orangeburg | 45075011803 | 55.32% | 27.23% |
| Pickens | 45077010502 | 69.29% | 12.66% |
| Pickens | 45077010601 | 80.61% | 21.47% |
| Pickens | 45077010805 | 67.63% | 27.22% |
| Pickens | 45077010806 | 71.42% | 27.26% |
| Pickens | 45077011003 | 58.36% | 14.10% |
| Pickens | 45077011104 | 58.86% | 36.92% |
| Pickens | 45077011105 | 63.84% | 16.74% |
| Pickens | 45077011202 | – | 56.60% |
| Pickens | 45077011204 | 94.61% | 43.72% |
| Richland | 45079000100 | 53.36% | 28.91% |
| Richland | 45079000300 | 49.88% | 33.10% |
| Richland | 45079000500 | 40.26% | 37.06% |
| Richland | 45079000900 | 32.49% | 52.13% |
| Richland | 45079001000 | 75.13% | 25.00% |
| Richland | 45079001100 | 92.06% | 20.62% |
| Richland | 45079001300 | 61.53% | 28.81% |
| Richland | 45079001600 | 117.83% | 24.87% |
| Richland | 45079002605 | 54.75% | 28.16% |
| Richland | 45079002800 | 28.60% | 74.28% |
| Richland | 45079003000 | 68.86% | 35.25% |
| Richland | 45079003100 | – | 69.36% |
| Richland | 45079010108 | 84.39% | 35.94% |
| Richland | 45079010304 | 57.89% | 22.18% |
| Richland | 45079010407 | 63.69% | 20.50% |
| Richland | 45079010408 | – | 97.83% |
| Richland | 45079010412 | 37.35% | 37.78% |
| Richland | 45079010413 | – | 23.77% |
| Richland | 45079010414 | 53.47% | 30.74% |
| Richland | 45079010501 | 48.16% | 19.60% |
| Richland | 45079010502 | 29.44% | 61.79% |
| Richland | 45079010600 | 47.73% | 28.31% |
| Richland | 45079010703 | 65.10% | 23.61% |
| Richland | 45079010803 | 63.31% | 18.52% |
| Richland | 45079010804 | 41.72% | 39.56% |
| Richland | 45079010805 | 60.43% | 13.69% |
| Richland | 45079010806 | – | 100.00% |
| Richland | 45079010900 | 16.91% | 64.53% |
| Richland | 45079011000 | 70.82% | 21.93% |
| Richland | 45079011303 | 61.45% | 11.64% |
| Richland | 45079011305 | 61.74% | 20.98% |
| Richland | 45079011412 | 87.29% | 22.33% |
| Richland | 45079011607 | 88.79% | 20.41% |
| Richland | 45079011608 | 57.47% | 14.77% |
| Richland | 45079011701 | – | 60.50% |
| Richland | 45079011702 | 58.15% | 25.24% |
| Richland | 45079011801 | 78.39% | 24.47% |
| Richland | 45079011901 | 63.99% | 27.65% |
| Richland | 45079012000 | 78.67% | 25.31% |
| Saluda | 45081960100 | 65.86% | 19.73% |
| Saluda | 45081960201 | 60.56% | 21.95% |
| Saluda | 45081960202 | 53.29% | 28.10% |
| Saluda | 45081960400 | 91.56% | 21.69% |
| Spartanburg | 45083020301 | 43.46% | 49.01% |
| Spartanburg | 45083020400 | 71.30% | 37.23% |
| Spartanburg | 45083020701 | 40.22% | 42.19% |
| Spartanburg | 45083020702 | 77.42% | 30.29% |
| Spartanburg | 45083020800 | 16.80% | 73.68% |
| Spartanburg | 45083021001 | 55.19% | 40.28% |
| Spartanburg | 45083021100 | 60.36% | 32.28% |
| Spartanburg | 45083021500 | 71.43% | 20.40% |
| Spartanburg | 45083021600 | 55.47% | 23.09% |
| Spartanburg | 45083021700 | 36.62% | 45.92% |
| Spartanburg | 45083021804 | 55.47% | 11.54% |
| Spartanburg | 45083021805 | 45.32% | 54.24% |
| Spartanburg | 45083021806 | 73.91% | 32.23% |
| Spartanburg | 45083021903 | 71.05% | 21.82% |
| Spartanburg | 45083022004 | 56.37% | 36.21% |
| Spartanburg | 45083022202 | 95.35% | 21.26% |
| Spartanburg | 45083022303 | 76.63% | 21.68% |
| Spartanburg | 45083022305 | – | 45.89% |
| Spartanburg | 45083022407 | 91.79% | 24.94% |
| Spartanburg | 45083022408 | 75.12% | 24.85% |
| Spartanburg | 45083022600 | 98.42% | 20.27% |
| Spartanburg | 45083023104 | 62.98% | 26.32% |
| Spartanburg | 45083023302 | 56.72% | 28.18% |
| Spartanburg | 45083023602 | 65.11% | 14.93% |
| Spartanburg | 45083023700 | 96.48% | 20.60% |
| Sumter | 45085000100 | 84.69% | 22.93% |
| Sumter | 45085000402 | 105.62% | 21.67% |
| Sumter | 45085000500 | 90.53% | 29.53% |
| Sumter | 45085000700 | 120.89% | 22.30% |
| Sumter | 45085000800 | 52.66% | 48.16% |
| Sumter | 45085001100 | 72.53% | 35.28% |
| Sumter | 45085001300 | 58.50% | 41.75% |
| Sumter | 45085001500 | 69.89% | 38.16% |
| Sumter | 45085001600 | 89.63% | 26.26% |
| Sumter | 45085001804 | 61.32% | 20.57% |
| Union | 45087030200 | 56.36% | 40.66% |
| Union | 45087030300 | 64.01% | 25.83% |
| Union | 45087030402 | 46.71% | 34.47% |
| Union | 45087030500 | 68.01% | 26.85% |
| Union | 45087030900 | 93.44% | 24.18% |
| Williamsburg | 45089970100 | 72.25% | 24.73% |
| Williamsburg | 45089970300 | 73.59% | 25.27% |
| Williamsburg | 45089970400 | 65.32% | 19.38% |
| Williamsburg | 45089970501 | 50.29% | 30.82% |
| Williamsburg | 45089970502 | 58.34% | 24.99% |
| Williamsburg | 45089970601 | 76.49% | 25.27% |
| Williamsburg | 45089970801 | 49.98% | 21.14% |
| Williamsburg | 45089970900 | 71.07% | 26.34% |
| York | 45091060200 | 57.51% | 29.73% |
| York | 45091060300 | 55.33% | 21.40% |
| York | 45091060401 | 49.93% | 29.56% |
| York | 45091060501 | – | 35.69% |
| York | 45091060502 | 69.68% | 11.66% |
| York | 45091060600 | – | 100.00% |
| York | 45091061601 | 67.38% | 18.02% |
| York | 45091061602 | 53.09% | 14.71% |