Only 60% of Current Opportunity Zones Are Fully Eligible For OZ 2.0 Designation
A tract-by-tract analysis of all 8,764 Opportunity Zones reveals that under the One Big Beautiful Bill Act's tighter criteria, 23% of current OZs are fully ineligible for re-designation, another 17% are only partially eligible, and just 45% of total OZ land area remains eligible.
When the One Big Beautiful Bill Act (OBBBA) made Opportunity Zones permanent last year, it also tightened the eligibility rules. The median family income threshold dropped from 80% to 70% of area or statewide median. (Tracts located in metropolitan statistical areas are measured against the area median, whereas non-metro tracts are measured against the statewide median.)
Under OZ 1.0, a tract could also qualify on poverty rate alone (if the tract's poverty rate was 20% or higher) — even if its median family income was high, which let some surprisingly affluent areas qualify on a technicality. OBBBA closes that path by adding a 125% MFI ceiling: a tract can no longer qualify via the poverty-rate route if its median family income exceeds 125% of the area or statewide median.
The non-low-income contiguous tract option — which governors used to nominate otherwise-ineligible tracts adjacent to low-income ones — was eliminated entirely.
Mapping OZ 1.0 to OZ 2.0
The starting point was the IRS list of OZ 2.0-eligible tracts, released in Rev. Proc. 2026-14. That list defines which census tracts meet the definition of low-income community under the new criteria. Notably, OZ 2.0 will be tied to the 2020 Census tract map. The 8,764 OZ 1.0 tracts designated in 2018 used the 2010 Census tract map.
Between 2010 and 2020, the Census Bureau redrew tract lines nationwide — splitting some, merging others, and shifting boundaries around. So the question, "Is my OZ 1.0 tract eligible under OZ 2.0?" is harder than it sounds, because the tract you care about may not exist as a single unit on the 2020 map at all.
To answer that question properly, we matched every OZ 1.0 tract to the 2020 tracts that now sit on the same physical land, using the U.S. Census Bureau's 2010-to-2020 tract relationship file, then layered in the OZ 2.0 eligibility flags from the IRS list.
The result, for each OZ 1.0 tract, is one of three classifications: fully eligible (the entire 2010 tract sits inside 2020 tracts that are eligible under OZ 2.0), not eligible (none of it does), or partially eligible (some portion of the old tract sits inside an eligible 2020 tract and some doesn't). The full spreadsheet is available for download at the end of this article.
The Headline Numbers
Of the 8,764 census tracts designated as Qualified Opportunity Zones under OZ 1.0:
- 5,259 tracts (60.0%) are fully eligible under OZ 2.0.
- 2,044 tracts (23.3%) are not eligible at all under OZ 2.0.
- 1,461 tracts (16.7%) are partially eligible. Some geographic portions of the original 2010 tract maps to an eligible 2020 tract, while other portions do not.
The "partially eligible" cohort warrants a closer look, because the bucket isn't really one bucket. It's three. About 490 of those 1,461 tracts are 99% or more eligible (typically minor boundary adjustments — though even a small ineligible sliver could matter if a specific project site happens to fall in it). About 215 are less than 1% eligible (the OZ land effectively migrated to a different 2020 tract that is not eligible). The remaining ~750 are genuinely mixed at levels that will materially affect investment decisions. We'll come back to what that means for due diligence below.
Weighted by land area, the picture looks more dramatic. Only 45.4% of OZ 1.0 land area is eligible for redesignation under OZ 2.0. Put another way, more than half the real estate currently treated as Opportunity Zone territory has lost eligibility for re-designation.
The gap between the tract-count figure (60%) and the land-area figure (45%) is itself a story. It means tracts that lost eligibility are, on average, larger than tracts that retained it — confirming that low-density rural tracts are disproportionately falling out of the program.
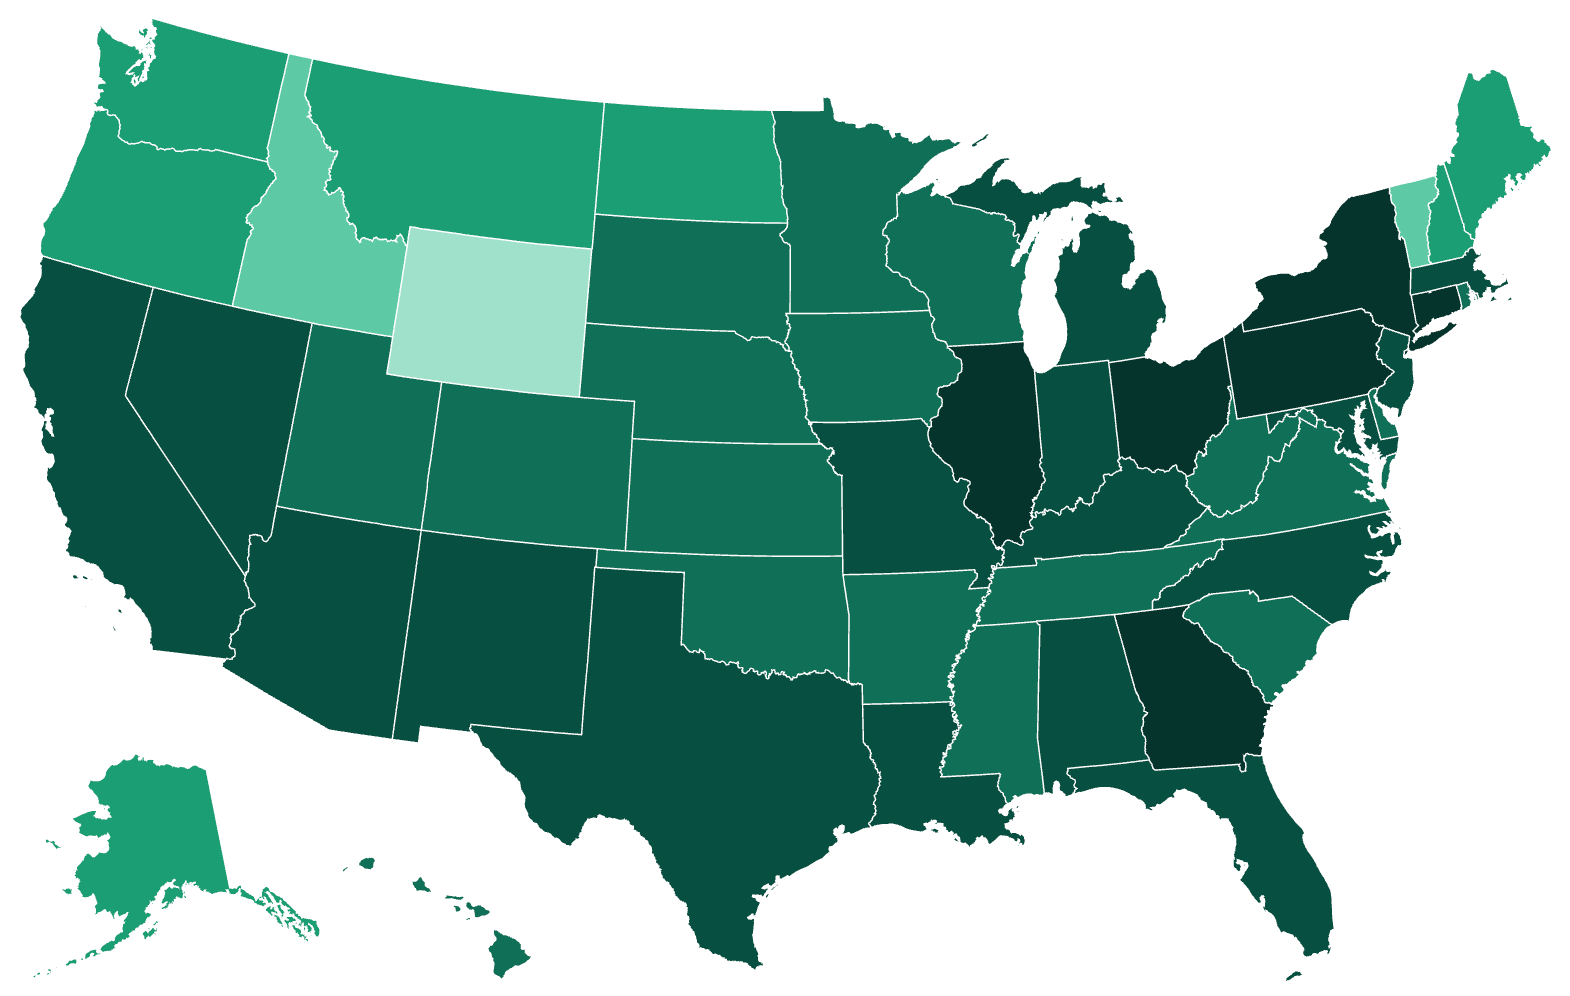
The State-by-State Story
Tract-count eligibility — the percentage of a state's OZ 1.0 tracts that are fully eligible under OZ 2.0 — varies enormously across jurisdictions. Here's the complete ranking of all 56 states, territories, and the District of Columbia, sorted from highest percentage of current zones fully eligible for OZ 2.0 designation to lowest.
| Rk | Jurisdiction | Fully Eligible for OZ 2.0 | % Fully Eligible |
|---|---|---|---|
| 1 | American Samoa | 16 of 16 | 100.0% |
| 2 | Northern Mariana Islands | 17 of 20 | 85.0% |
| 3 | Puerto Rico | 644 of 863 | 74.6% |
| 4 | Illinois | 243 of 327 | 74.3% |
| 5 | Georgia | 193 of 260 | 74.2% |
| 6 | Connecticut | 53 of 72 | 73.6% |
| 7 | District of Columbia | 18 of 25 | 72.0% |
| 8 | New York | 358 of 514 | 69.6% |
| 9 | Ohio | 221 of 320 | 69.1% |
| 10 | Pennsylvania | 203 of 300 | 67.7% |
| 11 | California | 579 of 879 | 65.9% |
| 12 | Missouri | 106 of 161 | 65.8% |
| 13 | Virgin Islands | 9 of 14 | 64.3% |
| 14 | Louisiana | 96 of 150 | 64.0% |
| 15 | Kentucky | 92 of 144 | 63.9% |
| 16 | Maryland | 91 of 149 | 61.1% |
| 17 | Florida | 258 of 427 | 60.4% |
| 18 | Alabama | 94 of 158 | 59.5% |
| 19 | New Jersey | 99 of 169 | 58.6% |
| 20 | Massachusetts | 80 of 138 | 58.0% |
| 21 | North Carolina | 141 of 252 | 56.0% |
| 22 | Nevada | 34 of 61 | 55.7% |
| 23 | New Mexico | 35 of 63 | 55.6% |
| 24 | Arizona | 92 of 168 | 54.8% |
| 25 | Indiana | 85 of 156 | 54.5% |
| 26 | Michigan | 156 of 288 | 54.2% |
| 27 | Texas | 339 of 628 | 54.0% |
| 28 | Nebraska | 23 of 44 | 52.3% |
| 29 | Delaware | 13 of 25 | 52.0% |
| 30 | South Carolina | 70 of 135 | 51.9% |
| 31 | Wisconsin | 61 of 120 | 50.8% |
| 32 | Tennessee | 89 of 176 | 50.6% |
| 33 | Oklahoma | 58 of 117 | 49.6% |
| 34 | Arkansas | 42 of 85 | 49.4% |
| 35 | Virginia | 103 of 212 | 48.6% |
| 36 | South Dakota | 12 of 25 | 48.0% |
| 37 | West Virginia | 26 of 55 | 47.3% |
| 38 | Colorado | 59 of 126 | 46.8% |
| 39 | Utah | 21 of 46 | 45.7% |
| 40 | Mississippi | 45 of 100 | 45.0% |
| 41 | Kansas | 33 of 74 | 44.6% |
| 42 | Hawaii | 11 of 25 | 44.0% |
| 43 | Iowa | 27 of 62 | 43.5% |
| 44 | Minnesota | 53 of 128 | 41.4% |
| 45 | Rhode Island | 10 of 25 | 40.0% |
| 46 | Washington | 54 of 139 | 38.8% |
| 47 | New Hampshire | 10 of 27 | 37.0% |
| 48 | Oregon | 31 of 86 | 36.0% |
| 49 | North Dakota | 9 of 25 | 36.0% |
| 50 | Alaska | 9 of 25 | 36.0% |
| 51 | Guam | 9 of 25 | 36.0% |
| 52 | Montana | 8 of 25 | 32.0% |
| 53 | Maine | 10 of 32 | 31.2% |
| 54 | Vermont | 5 of 25 | 20.0% |
| 55 | Idaho | 4 of 28 | 14.3% |
| 56 | Wyoming | 2 of 25 | 8.0% |
| Totals | 5,259 of 8,764 | 60.0% |
The pattern is unmistakable. Territories and dense-urban jurisdictions retain eligibility at the highest rates. Low-density rural states — particularly in the Mountain West and northern New England — lose the most. Wyoming sits at the bottom by tract count: only 2 of its 25 OZ 1.0 tracts are fully eligible under OZ 2.0. Idaho is barely better, with only 4 of 28 fully eligible — and on a land-area basis, Idaho is even worse, with just 2% of its OZ footprint retained, the lowest in the country.
The Idaho Case Study: How Tract Count and Land Area Tell Different Stories
The state-by-state table above ranks jurisdictions by the share of their OZ 1.0 tracts that remain fully eligible. By that measure, Idaho is second-to-last: just 4 of its 28 OZ tracts (14.3%) carry over. But by land area, Idaho is dead last and not close — only 2.0% of Idaho's OZ acreage remains eligible, the lowest in the country. The two metrics tell a related but different story, and Idaho is where the gap between them is starkest.
The reason is that three of Idaho's OZ 1.0 tracts — in Boundary, Clearwater, and Idaho Counties — collectively cover 4,475 square miles. That's nearly as much land as the entire state of Connecticut, packed into three census tracts. All three are ineligible under OZ 2.0, and they alone account for 62% of Idaho's current OZ footprint. When your largest rural tracts disappear, your land-area number collapses even if the per-tract loss looks more modest.
Meanwhile, the eligible-under-OZ-2.0 tracts in Idaho are concentrated in metro areas: Boise, Pocatello, Idaho Falls, Twin Falls, Coeur d'Alene. There are also 26 newly-eligible non-metro tracts scattered across smaller Idaho counties, but they're individually much smaller than the wilderness tracts they're effectively replacing — so the geography of OZ in Idaho is being relocated as well as compressed: from a few enormous rural tracts to many smaller urban and rural ones, with very little overlap between the OZ 1.0 and OZ 2.0 maps. This pattern shows up at its extreme in Idaho, but Wyoming, Montana, Nevada, Utah, and rural New England all show the same dynamic at smaller magnitudes.
Five Takeaways
1. The program is contracting, not just rotating.
OBBBA's tightened LIC criteria are projected to reduce the total number of OZ designations nationally by 25.3% — from the 8,764 tracts designated under OZ 1.0 in 2018 to a projected 6,544 under OZ 2.0, per analysis we published at OpportunityZones.com when the 2020-2024 American Community Survey dataset was first released.
Our analysis of all 8,764 OZ 1.0 designated tracts adds a second layer to that picture: 23% of current OZ 1.0 tracts lose eligibility outright, and another 17% are only partially eligible. The new program will be smaller and more selectively targeted than the old one.
2. Existing investments are safe. Redeployment is the question.
OZ 1.0 designations don't expire until December 31, 2028 (or December 31, 2027 for Puerto Rico, which has its own statutory timeline). Investors who deployed capital into a QOF targeting a now-ineligible tract don't lose anything. The 10-year benefits, the tax deferral mechanics — all of that continues to operate.
And even after OZ 2.0 takes effect on January 1, 2027, the two programs run in parallel for a stretch: OZ 1.0 tracts remain valid investment destinations until their statutory expiration dates. What changes is what happens after that. Once your OZ 1.0 designations expire, any future capital deployment into the same geography depends on whether the underlying tracts also qualify under OZ 2.0 — and for many tracts, they won't.
This matters most for fund sponsors with a narrow geographic focus. If your fund's thesis was built around a specific tract or set of tracts, and those tracts don't survive the OZ 2.0 cut, the second-cycle capital deployment strategy is going to require a reset.
3. Rural America loses big. The rural story within the rural story is complicated.
The headline narrative — "OZ 2.0 is more urban than OZ 1.0" — holds at the state level. Six of the bottom eight states by eligibility retention are low-density rural states. But dig one layer deeper and the picture is more interesting.
First, not all rural losses are equal. Some rural tracts are becoming ineligible because their populations have genuinely stabilized or grown (think the post-pandemic migration to places like Coeur d'Alene and Bozeman). Others are becoming ineligible because the statutory MFI threshold moved from 80% to 70% of statewide median, cutting off tracts that were always going to be at the margin.
Second, OBBBA created a new Qualified Rural Opportunity Fund (QROF) category with enhanced incentives for investment in rural OZs that do get designated. So the rural story is not simply "fewer opportunities." It's "different rural opportunities, with improved tax treatment."
If you're a rural-focused investor, the strategic question isn't whether rural OZs will exist after 2027. It's which rural tracts will qualify, and whether your existing pipeline has any overlap with the new eligible universe.
4. The partial tracts are where careful due diligence lives.
For a specific project in an existing OZ 1.0 tract that is only partially eligible for re-designation, the question isn't "is this tract eligible?" The question is "is this parcel contained in an OZ 2.0-eligible tract?" That requires parcel-level work against the 2020 tract boundaries.
Our spreadsheet can tell you that a 2010 tract is, say, 47% eligible and that the eligible portion corresponds to 2020 tracts X and Y. It can't tell you whether your specific project site is in X or in the other piece. For that, use the OpportunityZones.com OZ 2.0 Eligibility Map, which lets you look up any address against the 2020 tract boundaries.
5. Puerto Rico is the biggest loser, even though it ranks third on our table.
Puerto Rico ranks #3 by share of OZ 1.0 tracts retaining eligibility (74.6%), which sounds like good news. It isn't. Under OZ 1.0, every low-income tract in Puerto Rico was automatically designated as an OZ — a statutory special rule unique to the territory — which is why the island has 863 OZ 1.0 tracts, more than any state except California.
Under OZ 2.0, that special rule is gone. Puerto Rico will play by the same rules as every other jurisdiction: the Governor of Puerto Rico will nominate just 25% of the island's eligible LIC tracts. So even though three-quarters of PR's OZ 1.0 tracts remain eligible, only a fraction of those eligible tracts will actually be designated. Puerto Rico is projected to have just 178 OZ 2.0 designations — a 79% decrease from its 863 OZ 1.0 tracts, and 685 fewer OZs in absolute terms. By that measure, Puerto Rico is the biggest loser of any jurisdiction in the country.
What Happens Next
The OZ 2.0 designation window, set by OBBBA, runs from July 1 through October 28, 2026. Governors will nominate up to 25% of their eligible LIC tracts (with a 25-tract minimum for small states). The new designations will take effect January 1, 2027.
Between now and then, every state is going to make hard choices about which eligible tracts to nominate. Our analysis doesn't predict which tracts governors will pick — that's a political question as much as a data question. But it does tell you the outer boundary of what's possible: the pool of tracts available for designation is smaller than it was in 2018, and the geography of that pool is meaningfully different.
If you're an investor, a fund sponsor, or a community development professional, we'd encourage you to download the full spreadsheet (linked below) and look up the specific tracts you care about. For each OZ 1.0 tract, you'll see:
- Its OZ 2.0 eligibility status (Yes / No / Partial)
- The exact percentage of its 2010 land area that remains eligible
- Which 2020 tracts it maps to, and which of those are eligible vs. ineligible
- Notes on any data quirks affecting the determination
The spreadsheet also includes a State Summary tab with the full ranking of all 56 jurisdictions, so you can see where your state sits in the national picture.
And if any of this raises questions specific to your portfolio, your project, or your state — that's exactly the kind of thing we work through in OZ Insiders. But start with the data. It's the most complete picture we know of on this question, and it should be useful regardless of whether you take any next step with us.
Methodology, Data Download, and Other Resources
This analysis matches every OZ 1.0 tract designated in 2018 (which used 2010 Census tract boundaries) to its corresponding land area on the 2020 Census map (which is what OZ 2.0 eligibility is measured against). The challenge is that there is no one-to-one correspondence between the two vintages: between the 2010 and 2020 censuses, the Census Bureau split, merged, and adjusted tract boundaries nationwide. You can't simply match on tract ID — the 11-digit identifier of a 2010 OZ tract may not exist at all in the 2020 universe, or it may refer to a geographic area that doesn't quite match what it meant in 2010.
We used three publicly available data sources: the 2018 OZ designation list (8,764 tracts), Treasury's OZ 2.0 eligibility determinations (covering all 85,508 census tracts in the 2020 Census universe), and the U.S. Census Bureau's 2010-to-2020 Census Tract Relationship File. The Relationship File is the key piece — it documents every overlap between every 2010 tract and every 2020 tract, with the land area of each overlap measured in square meters.
For each OZ 1.0 tract, we calculated the percentage of its 2010 land area that maps to 2020 tracts eligible under OZ 2.0:
% eligible = (sum of overlap areas where 2020 tract is eligible) / (total 2010 tract area) × 100
Tracts at 100% are classified as Yes, tracts at 0% as No, and everything in between as Partial. State-level rollups are computed two ways: by tract count (treating each tract equally) and by land area (weighting larger tracts more heavily). The two approaches tell different stories — the tract-count and land-area gap is itself a finding — and we report both throughout this article.
Two data quirks required custom handling and are documented in detail in the accompanying methodology document: a Connecticut county-to-Planning-Region bridge (Connecticut replaced its counties with new geographic units in 2022, breaking the usual ID matching) and a Bedford, Virginia adjustment (one tract carries a hybrid identifier due to Bedford's 2013 reversion from independent city to county status). Without these adjustments, parts of the analysis would have produced wrong answers — Connecticut, in particular, would have falsely appeared at 0% eligibility.
The full technical documentation, including all formulas, edge cases, and known limitations, is available in the accompanying methodology document linked alongside the spreadsheet download below.
Download the full analysis: OZ 2.0 Eligibility Crosswalk — all 8,764 OZ 1.0 tracts, classified against OZ 2.0 eligibility, with land-area percentages, successor tract mappings, and state-level rollups. Methodology document included.