
OZ 2.0 Was Supposed to Be More Rural. Early Nominations Say Otherwise.

OZ 2.0 is shaping up to be less rural than OZ 1.0. That may come as a surprise given that Congress wrote rural investment into the heart of the new law. Across the 12 states that have so far published their OZ 2.0 nominated tracts lists, 37.2% of the 1,566 known nominated tracts are rural, down from 44.8% of the same states' 2018 Opportunity Zones drawn from low-income tracts.
That looks like a retreat from rural America, and in part it is. Governors can only nominate from a list of eligible tracts, and that list is about as rural today as it was in 2018. They still favor rural tracts, picking more of them than the pool offers. But they favor them only about half as strongly as they did in 2018.
In 2018, the 12 states with published OZ 2.0 lists nominated about 14.1 points more rural tracts than their pools offered. This round, the margin is just +6.9 points, and the states that leaned hardest in 2018 pulled back the most. Texas accounts for nearly 40% of the nominations published so far, but the pattern is not just Texas: seven of the 12 states have individually reduced their rural lean since 2018.
Across the 48 states where governors had a rural choice to make, the rural share of eligible tracts hasn't changed at all: 32.1% of eligible tracts were rural in 2018, and 32.1% are rural now. (That figure leaves out places where governors had no real rural choice to make: Vermont, West Virginia and the smaller island territories, where every eligible tract is rural; the District of Columbia, which has no rural tracts; and Puerto Rico, where every eligible tract was designated in 2018.)
OZ 1.0's zones came out 36.9% rural because governors nationwide leaned rural by about 5 points. If the rest of the country follows these 12 states, OZ 2.0 will end up less rural than OZ 1.0. But given the relatively low sample size (we are only analyzing the earliest 12 out of 48 states, home to about a quarter of the eligible tracts), it is too early to put a number on it.
Why this round was supposed to be more rural
The One Big Beautiful Bill Act made Opportunity Zones permanent in July 2025 and wrote rural investment into the program's core. The new rules give rural deals a clear edge:
- Triple the basis step-up. Investors in a Qualified Rural Opportunity Fund (QROF), which holds at least 90% of its assets in rural zones, get a 30% step-up after five years. Investors in non-rural Qualified Opportunity Funds (QOFs) get just 10%.
- A lower bar for existing buildings. Substantial improvement for property located in rural zones drops from 100% of basis to just 50%.
The same law tightened eligibility. Tracts now need median family income at or below 70% of the area median, down from 80%, and the contiguous-tract rule is gone. The IRS's eligible list in Rev. Proc. 2026-14 contains 25,332 tracts, down from 42,176 in 2018, and 8,334 of them (32.9%) are rural. Treasury added 128 more under Alternate Framework 1 on September 28, without official rural flags, so this analysis infers their status from neighboring tracts.
Governors may nominate up to 25% of their eligible tracts. The new zones take effect January 1, 2027. With the enhanced rural benefits, many expected the new Opportunity Zone designations to lean more rural, an expectation that may not pan out.
Same menu, different choice
A rural share on its own doesn't show how hard a governor leaned rural, because it depends on what the pool offered. A state whose eligible tracts are mostly rural will nominate mostly rural tracts almost by default.
A more meaningful measure is a state's rural tilt: the nominated rural share minus the pool's rural share. A positive tilt means the state picked more rural tracts than a random draw from its pool would have produced. Measuring it for 2018 required something we could not find published anywhere: the rural share of the 31,848 low-income tracts that were eligible that year (30,568 of them in the 48 states analyzed here, not counting the non-low-income contiguous tracts that were also eligible).
So we rebuilt it ourselves, applying the IRS's own rural test to every tract that was eligible in 2018. The rebuild isn't perfect, but it matches the IRS's rural flags on 99% of the 2018 zones. The Methodology section below explains how it works.
Rural share | 12 states analyzed | 48 states |
|---|---|---|
2018 pool | 30.7% | 32.1% |
2018 zones | 44.8% | 36.9% |
2018 tilt | +14.1 pts | +4.8 pts |
2026 pool | 30.3% | 32.1% |
2.0 nominations | 37.2% | — |
2026 tilt | +6.9 pts | — |
Three things stand out:
- The menu didn't change. Nationally and in the 12 states analyzed here, the 2026 pool is almost exactly as rural as the 2018 pool. Any change in rural share is a choice.
- In 2018, governors leaned rural. Nationally they picked rural tracts about 5 points more often than the pool offered. The 12 states analyzed here leaned about three times as hard as the national average in 2018.
- In OZ 2.0, those 12 states have cut that lean roughly in half, and the pullback is concentrated in the states that leaned hardest in 2018.
What does that mean for the national map? It is too early to say, because the early states are not a typical sample. Four of the five states that leaned hardest toward rural tracts in 2018 have already published their lists, and none of the 11 that leaned even slightly away from rural tracts has. The states that leaned hardest have pulled back the most so far, so these early lists may overstate the national shift. States that leaned little or not at all in 2018 could move the other way, as Arizona, Indiana, Nebraska and Delaware did. How those two effects net out nationally will not be clear until more lists are published.
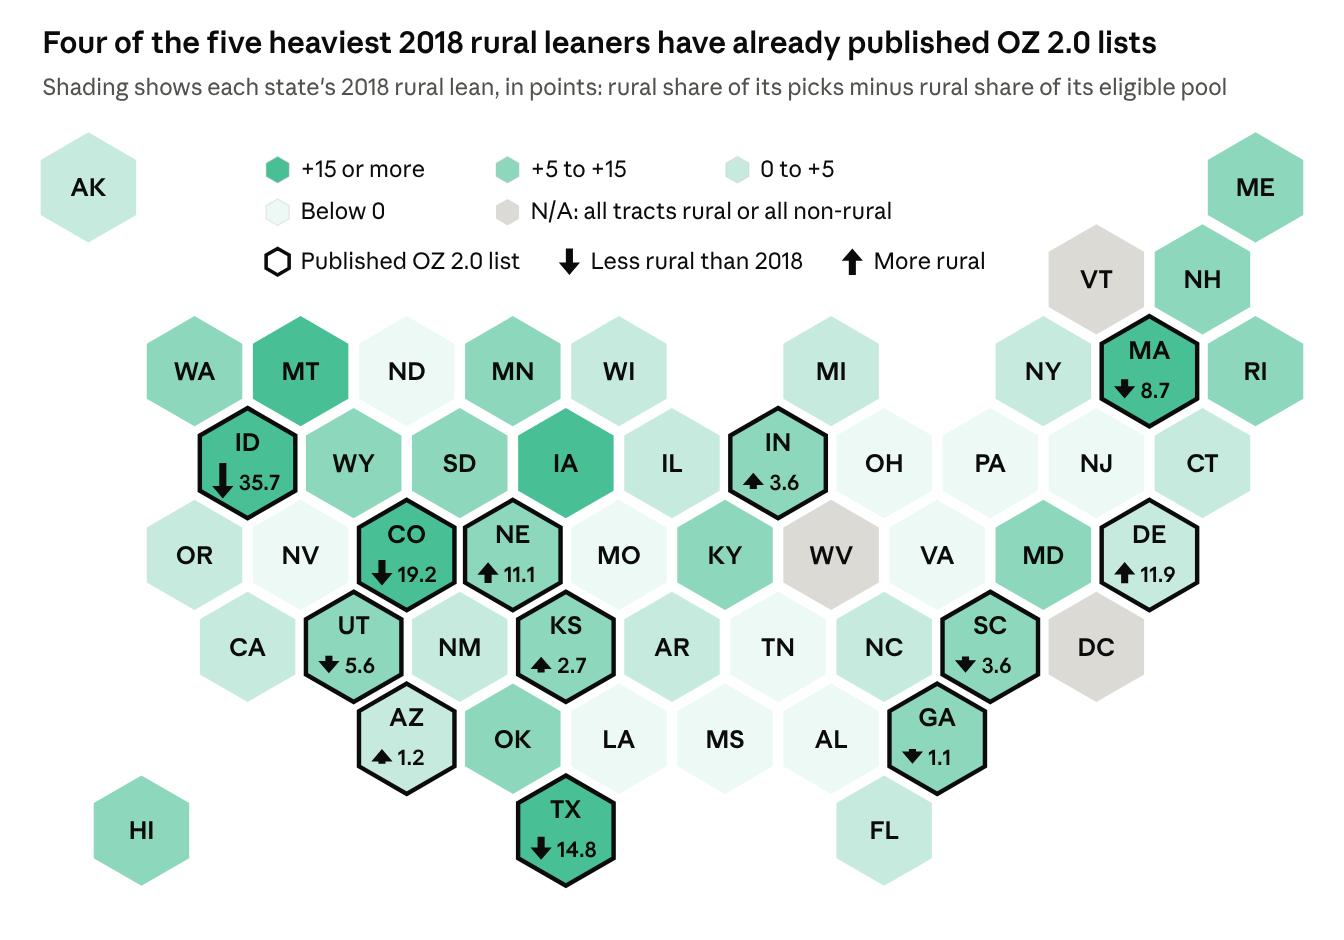
The U.S. Virgin Islands has also published its nominations, but every tract there is rural, so it is left out of this analysis. Puerto Rico is left out because every eligible tract was designated in 2018, so there was no choice to measure. The District of Columbia is left out because it has no rural tracts at all, and Vermont and West Virginia are left out of national totals because every eligible tract in both is rural.
State by state
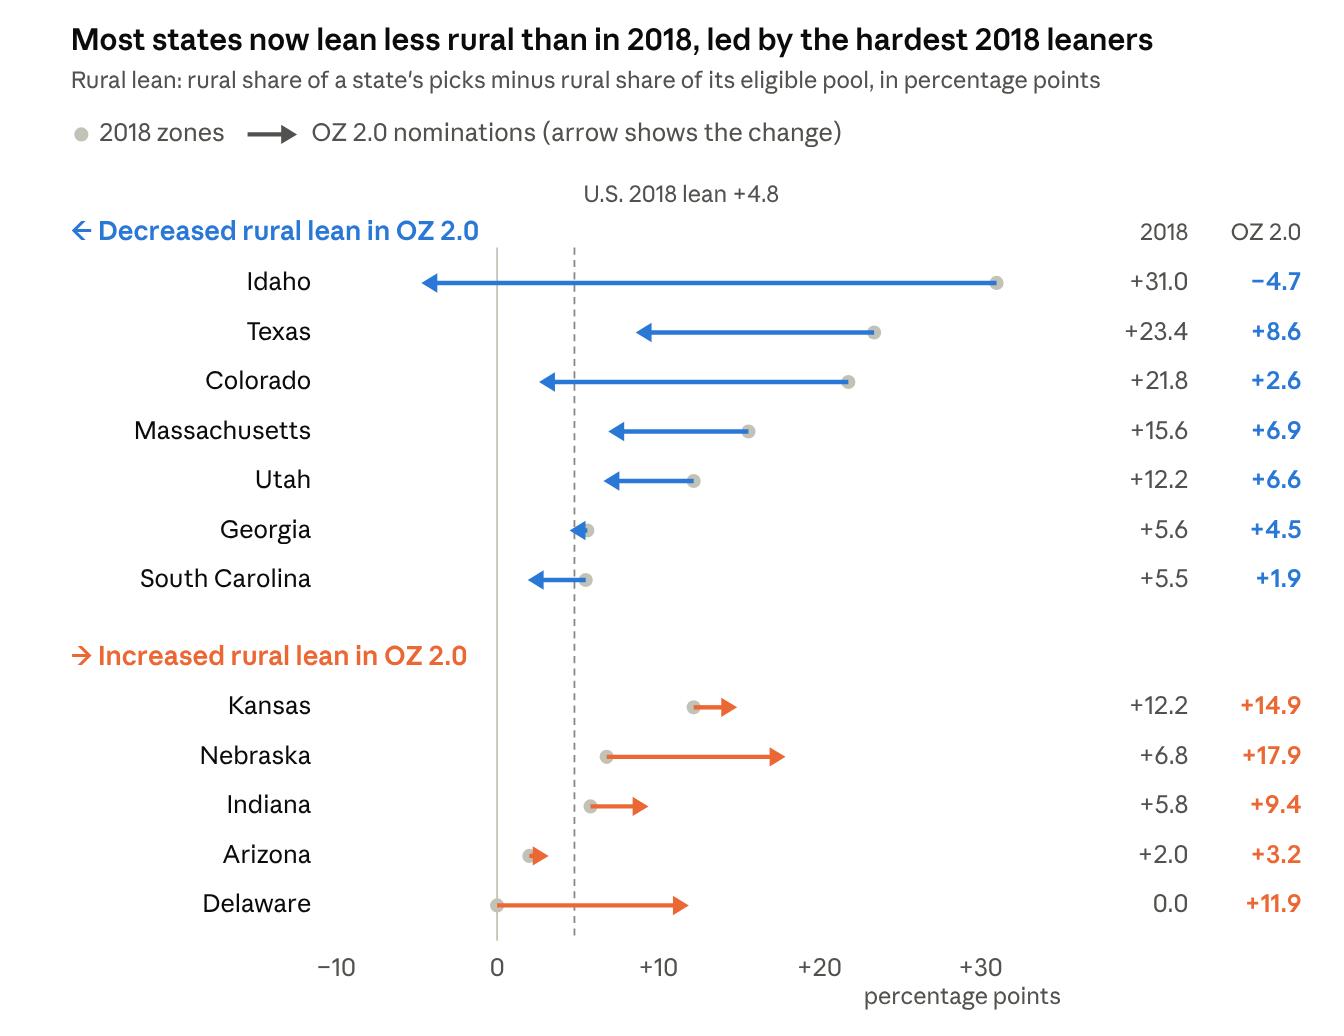
Each arrow runs from a state's 2018 lean (gray dot) to its OZ 2.0 lean. Seven of the 12 states now lean less rural than they did in 2018, including the four that leaned hardest among them in 2018. The other five moved further toward rural.
- Idaho made the sharpest turn. It went from a 31-point lean toward rural tracts to a nearly 5-point lean toward non-rural ones. It is the only one of the 12 early states picking fewer rural tracts than its pool offers.
- Texas, Colorado, and Massachusetts pulled back hard, but each still nominated a more rural mix than its pool.
- Nebraska, Delaware, Kansas, Indiana, and Arizona moved the other way. Delaware went from no lean at all to an 11.9-point rural lean, and Nebraska's 17.9-point tilt is the strongest of the 12 early states. Kansas, already a strong rural leaner in 2018 at 12.2 points, leans even harder now at 14.9.
- Georgia held steady. About half its 235 nominations are rural (48.9%), the highest share of any large state so far. But its pool is 44.4% rural, so its lean of 4.5 points is close to its 2018 lean of 5.6. Georgia nominated a rural-heavy list mostly because it had a rural-heavy menu.
One caution applies. Some states nominated only a few dozen tracts. In a 25-tract list, a single tract moves the state's lean by about 4 points. Read the small states as direction, not precision.
What about Texas?
Texas is the clearest example of a state shifting its focus from the countryside toward its cities. It nominated 608 tracts, nearly 40% of all nominations analyzed here.
Texas's eligible pool barely changed: 22.5% rural in 2018 and 21.7% now. But in 2018 it designated zones that were 45.9% rural, a 23-point lean toward rural tracts. This round it nominated 30.3% rural tracts, a lean of about 8.6 points.
With the pool unchanged, the entire drop is Texas's choice. It cut its rural lean by nearly two-thirds. It did not abandon rural tracts, but it moved decisively toward urban ones. In all, Texas went from 288 rural and 340 non-rural zones in 2018 to 184 rural and 424 non-rural nominations: 104 fewer rural tracts and 84 more non-rural ones.
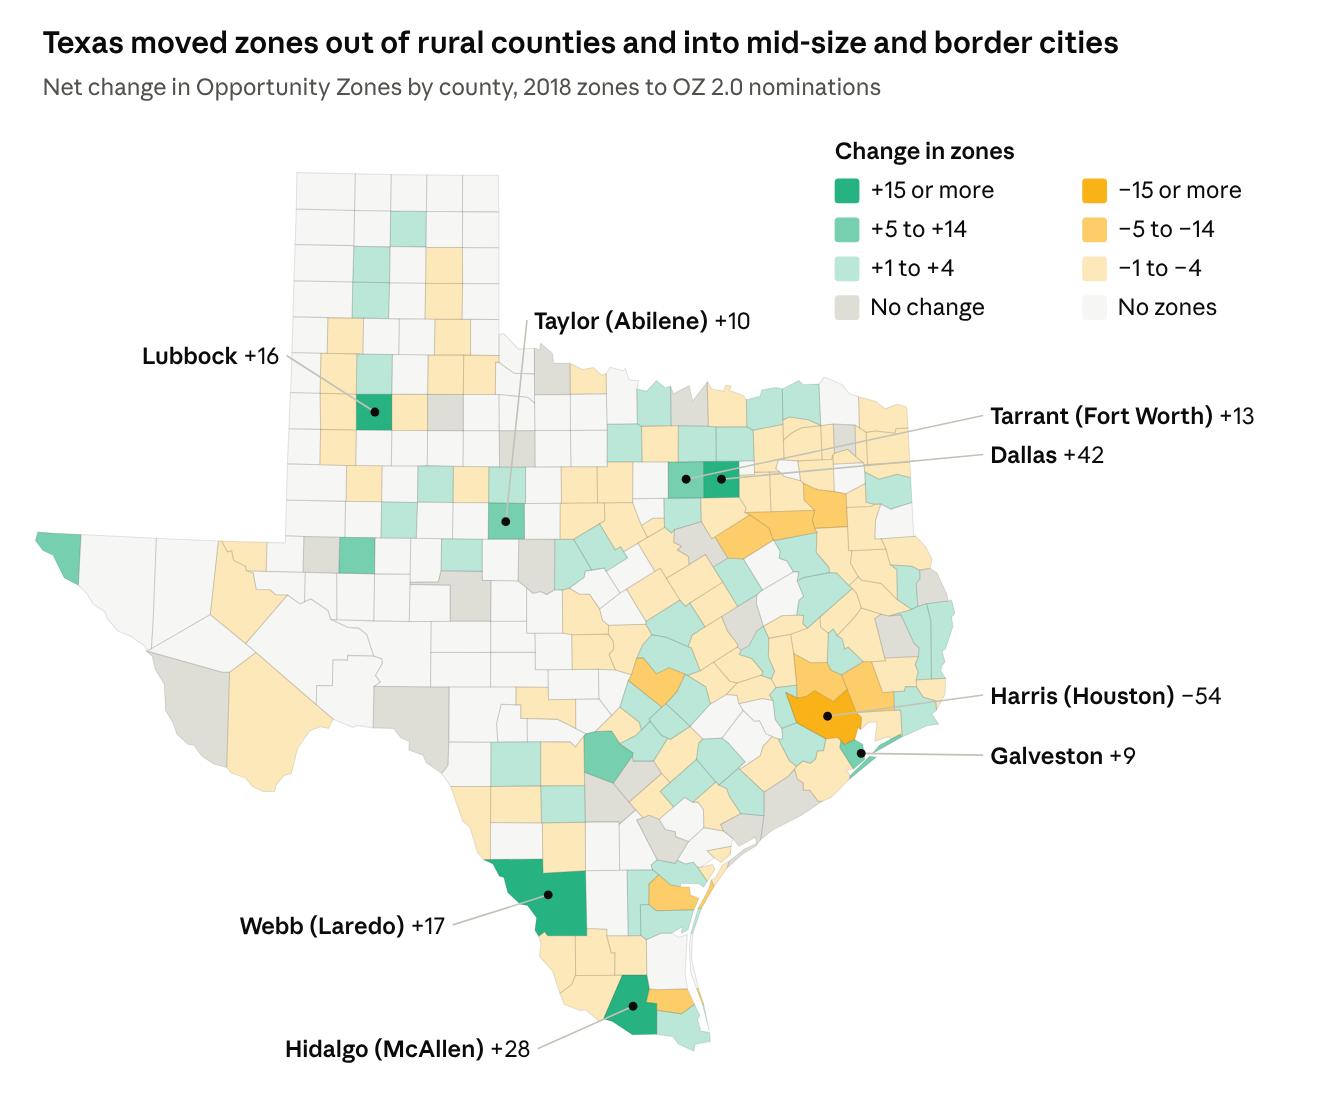
Those gains did not go mainly to the state's biggest metros. Texas's six largest metro counties went from 191 zones to 201 nominations, a net gain of just 10. The real shift was out of rural counties and into mid-size and border cities:
Texas counties | 2018 zones | OZ 2.0 nominations | Change |
|---|---|---|---|
6 largest metro counties | 191 | 201 | +10 |
33 other counties with urban tracts | 187 | 259 | +72 |
120 counties with only rural tracts | 250 | 148 | −102 |
Total | 628 | 608 | −20 |
Outside the big six, the biggest gains came in Hidalgo County (McAllen), up 28; Webb County (Laredo), up 17; Lubbock County, up 16; Taylor County (Abilene), up 10; and Galveston County, up 9. Among the big six, the map was reshuffled rather than expanded: Dallas County gained 42 zones while Houston's Harris County lost 54.
Why states are leaning less rural
Where states explained their choices, one theme dominates: investment readiness. Several said outright that they favored tracts where capital is likely to arrive soon.
- Texas scored nominations on a 10-point scale. Eight points went to local support ("incentives offered, rebates, and agreements") and project viability ("sites where private capital can realistically deploy in 24–48 months"). Rural tracts appear only in a 2-point category for geographic balance, which tells the state to "leverage rural incentives without selecting unworkable tracts."
- Massachusetts "prioritized tracts that are positioned to translate an Opportunity Zone designation into new investment, including places with projects in the pipeline, demonstrated developer interest, supportive local zoning and other enabling conditions."
- Utah weighed "data on existing infrastructure" along with input from local economic developers.
- Delaware stated the lesson from OZ 1.0 most plainly: "A tax incentive cannot make an unsustainable investment successful."
Texas, Massachusetts and Utah all pulled back from their 2018 rural lean. Idaho and Colorado, the two biggest pullbacks, published no selection criteria at all.
Readiness does not have to mean urban, though. Delaware applied the same test and still raised its rural count from nine tracts to 12. The states that named rural areas as an explicit goal held steady or leaned further rural. Indiana listed "rural competitiveness" among its priorities and brought its rural affairs and agriculture agencies into the process. Georgia aimed for "nearly a 50/50 split between rural and metro areas."
How states gathered nominations may also matter. In Texas, Indiana and Delaware, local governments and economic development groups proposed the tracts. Cities typically have more staff and more projects to put forward, which can tilt a bottom-up process toward urban tracts.
Treasury's own data shows why readiness tends to favor cities. A June 2026 working paper from the Office of Tax Analysis, covering investment through tax year 2024, found that 77% of rural zones received some QOF investment, the same rate as all zones. But the average rural zone that received investment got $7.3 million of QOZ property, compared with $23.3 million for the average non-rural zone. Rural tracts made up about 38% of zones but just over 16% of OZ investment through 2024. A governor trying to put the most capital to work in each slot has a reason to favor non-rural tracts.
The 2.0 rural incentives are aimed squarely at that dollar gap. A 30% step-up and a 50% improvement threshold are meant to make larger rural deals pencil. Congress changed the economics of investing in rural Opportunity Zones. Governors appear to be responding instead to the economics of getting projects financed at all. Most of them still lean rural, just less than before.
What to watch next
Twelve states is an early read. October 28 is the final deadline for states to submit their nominations, and more states will publish their nominated tract lists over the next several weeks. Some may not release their lists until Treasury certifies the nominations, which could take until December 27. By then we will have the full national list. We will update this analysis once that full list is finalized. In the meantime, you can follow each state's progress on the OZ 2.0 State Tracker.
The states to watch are the ones that leaned hardest toward rural tracts in 2018: Iowa (+21.9), Montana (+15.1), New Hampshire (+12.0), South Dakota (+11.6) and Rhode Island (+11.2). If the early pattern holds, they are the most likely to pull back, though Kansas shows it is not a rule. On the other end, watch Pennsylvania (−8.2), Missouri (−8.3) and Alabama (−8.4), the states that leaned furthest away from rural tracts in 2018. If the pattern holds, they are the most likely to move toward rural.
The bottom line
The early evidence does not show governors abandoning rural Opportunity Zones. It shows something subtler: even after Congress made rural investment substantially more attractive, seven of the 12 governors with published lists are using less of their nomination power to favor rural places than their states did in 2018, while the other five are leaning further toward rural. Whether that becomes the national pattern will depend on the states still to come.
Every state's rural lean
A state's rural lean is the rural share of the tracts it picked minus the rural share of its eligible pool. A positive number means it picked more rural tracts than its pool offered. Nationally, governors leaned rural by 4.8 points in 2018. States are sorted by their 2018 lean, from most rural to least. The 12 states with published OZ 2.0 lists show their new lean and the change.
State | 2018 lean | OZ 2.0 lean | Change |
|---|---|---|---|
Idaho | +31.0 | −4.7 | −35.7 |
Texas | +23.4 | +8.6 | −14.8 |
Iowa | +21.9 | — | — |
Colorado | +21.8 | +2.6 | −19.2 |
Massachusetts | +15.6 | +6.9 | −8.7 |
Montana | +15.1 | — | — |
Utah | +12.2 | +6.6 | −5.6 |
Kansas | +12.2 | +14.9 | +2.7 |
New Hampshire | +12.0 | — | — |
South Dakota | +11.6 | — | — |
Rhode Island | +11.2 | — | — |
Oklahoma | +11.1 | — | — |
Washington | +9.5 | — | — |
Maryland | +8.6 | — | — |
Hawaii | +8.1 | — | — |
Nebraska | +6.8 | +17.9 | +11.1 |
Minnesota | +6.8 | — | — |
Indiana | +5.8 | +9.4 | +3.6 |
Georgia | +5.6 | +4.5 | −1.1 |
Maine | +5.6 | — | — |
South Carolina | +5.5 | +1.9 | −3.6 |
Kentucky | +5.5 | — | — |
Wyoming | +5.3 | — | — |
Michigan | +4.8 | — | — |
Florida | +4.0 | — | — |
Illinois | +3.6 | — | — |
Connecticut | +3.3 | — | — |
New Mexico | +2.7 | — | — |
North Carolina | +2.6 | — | — |
California | +2.4 | — | — |
Arizona | +2.0 | +3.2 | +1.2 |
New York | +1.4 | — | — |
Arkansas | +1.3 | — | — |
Wisconsin | +1.2 | — | — |
Alaska | +0.5 | — | — |
Delaware | 0.0 | +11.9 | +11.9 |
Oregon | 0.0 | — | — |
Ohio | −0.2 | — | — |
Nevada | −0.7 | — | — |
New Jersey | −0.8 | — | — |
Mississippi | −0.9 | — | — |
Tennessee | −1.3 | — | — |
Virginia | −1.4 | — | — |
Louisiana | −1.5 | — | — |
North Dakota | −1.5 | — | — |
Pennsylvania | −8.2 | — | — |
Missouri | −8.3 | — | — |
Alabama | −8.4 | — | — |
District of Columbia | n/a | — | — |
Vermont | n/a | — | — |
West Virginia | n/a | — | — |
Small states can swing several points on a handful of tracts. Every eligible tract in the District of Columbia is non-rural, and every eligible tract in Vermont and West Virginia is rural. With no mix to choose from, none of the three can have a lean, so all three are left out of the national figures.
Methodology
This analysis covers the 12 states whose nominated tract lists are published in the OZ 2.0 State Tracker: Arizona, Colorado, Delaware, Georgia, Idaho, Indiana, Kansas, Massachusetts, Nebraska, South Carolina, Texas and Utah. Figures are as of October 6, 2026.
- Rural flags for 2018 zones match the IRS list of 3,309 rural zones in Notice 2025-50.
- Rural flags for 2.0 tracts come from the Rural Status column of the IRS eligible-tract list in Rev. Proc. 2026-14.
- The eligible pool is every listed tract in a jurisdiction, including the tracts Treasury added on September 28.
- Each share is rural tracts over all tracts, rounded to one decimal.
- The 2018 eligible pool is the 31,848 low-income tracts on the CDFI Fund's 2018 nomination list. The 10,312 contiguous non-low-income tracts are excluded, because states could draw only up to 5% of nominations from that list and OZ 2.0 dropped the rule.
- Rural status for the 2018 pool applies the test in IRS Notice 2025-50 to every 2018-eligible tract. A tract is rural unless it overlaps an incorporated city of more than 50,000 people in the 2020 Census, or a 2020 urban area that touches such a city. Overlaps under 0.1% of a tract's area are ignored. The rebuild matches the IRS's own flags on 99.0% of the 8,764 designated 2018 zones, and on 99.4% of 11,868 other 2018 tracts that kept their ID into the 2026 list.
- 2018 zones are limited to those drawn from the low-income list.
Caveats
- Our rebuild is not exact. It disagrees with the IRS on 87 of 8,764 designated zones, almost all of them tracts the IRS calls rural that sit inside urban areas. Notice 2025-50 does not say how Treasury decided those cases, so the rebuilt 2018 pool shares may run a few tenths of a point low.
- D.C., Puerto Rico, the other island territories, Vermont and West Virginia are excluded from tilt figures. In each, governors had no rural choice to make: every eligible Puerto Rico tract was designated in 2018, D.C. has no rural tracts, and every eligible tract in the other territories, Vermont and West Virginia is rural.
- These are nominations, not final designations. Lists can change. Texas, for example, revised its count from 605 to 608 on September 25.
- Texas dominates the pooled figures. It accounts for 608 of 1,566 OZ 2.0 nominations and 628 of 1,828 OZ 1.0 zones from 2018. The state-by-state results are the better read.
- Boundaries differ. The 2018 zones use 2010 census tracts and the 2.0 nominations use 2020 tracts, so this compares shares, not the same land.
- The rural status is inferred for three OZ 2.0 nominated tracts. Treasury's September 28 additions under Alternate Framework 1 came without an official rural flag. Three nominated tracts fall in that group (one in Suffolk County, Mass., two in Travis County, Texas). All three were inferred to be non-rural based on neighboring tracts.
- Treasury's working paper uses its own rural definition, built from 2020 Census urban blocks, so its 38% rural figure is close to but not identical to the IRS count.
Sources
- OZ 2.0 State Tracker, OpportunityZones.com
- Use of the Opportunity Zone Tax Incentive through 2024: An Update, Treasury Office of Tax Analysis Working Paper 128, June 2026
- OBBBA Aims to Increase Opportunity Zones Investment in Rural Areas, Novogradac
- Texas Opportunity Zone 2.0 presentation, Texas Economic Development & Tourism Office
- 2026 Massachusetts Opportunity Zone Program, Commonwealth of Massachusetts
- Utah Opportunity Zones, Utah Governor's Office of Economic Opportunity
- Governor Meyer announces 25 Delaware communities nominated for next generation of Opportunity Zones, State of Delaware
- Indiana Opportunity Zones designation process, Indiana Economic Development Corporation
- Georgia designated federal Opportunity Zones, Georgia Department of Community Affairs
- Colorado Opportunity Zone Program, Colorado OEDIT
- Treasury approves Idaho Opportunity Zone 2.0 nominations, Idaho Commerce
- Opportunity Zones, Office of the Texas Governor
- Notice 2025-50, Substantial Improvement of Property in Rural Areas, IRS
- TIGER/Line shapefiles: 2010 census tracts, 2020 places and 2020 urban areas, U.S. Census Bureau
- CDFI Fund 2018 Opportunity Zone nomination tool, low-income and contiguous tract lists distributed to states in 2018