OZ Pitch Day On-Demand
Opportunity Zones by Location
List of Opportunity Zones by State
There are 8,764 opportunity zones in the United States. Here is the breakdown by state. U.S. overseas territories and Washington DC are also included.
| Location | Designated Opportunity Zones | Low-Income Tracts | Non-LIC Contiguous Tracts |
|---|---|---|---|
| Alabama | 158 | 153 | 5 |
| Alaska | 25 | 25 | 0 |
| American Samoa | 16 | 16 | 0 |
| Arizona | 168 | 160 | 8 |
| Arkansas | 85 | 83 | 2 |
| California | 879 | 871 | 8 |
| Colorado | 126 | 119 | 7 |
| Connecticut | 72 | 71 | 1 |
| Delaware | 25 | 24 | 1 |
| Florida | 427 | 427 | 0 |
| Georgia | 260 | 260 | 0 |
| Guam | 25 | 23 | 2 |
| Hawaii | 25 | 23 | 2 |
| Idaho | 28 | 26 | 2 |
| Illinois | 327 | 327 | 0 |
| Indiana | 156 | 153 | 3 |
| Iowa | 62 | 61 | 1 |
| Kansas | 74 | 70 | 4 |
| Kentucky | 144 | 139 | 5 |
| Louisiana | 150 | 145 | 5 |
| Maine | 32 | 30 | 2 |
| Maryland | 149 | 145 | 4 |
| Massachusetts | 138 | 137 | 1 |
| Michigan | 288 | 283 | 5 |
| Minnesota | 128 | 127 | 1 |
| Mississippi | 100 | 95 | 5 |
| Missouri | 161 | 153 | 8 |
| Montana | 25 | 25 | 0 |
| Nebraska | 44 | 43 | 1 |
| Nevada | 61 | 60 | 1 |
| New Hampshire | 27 | 27 | 0 |
| New Jersey | 169 | 169 | 0 |
| New Mexico | 63 | 59 | 4 |
| New York | 514 | 497 | 17 |
| North Carolina | 252 | 241 | 11 |
| North Dakota | 25 | 25 | 0 |
| Northern Mariana Islands | 20 | 20 | 0 |
| Ohio | 320 | 317 | 3 |
| Oklahoma | 117 | 114 | 3 |
| Oregon | 86 | 81 | 5 |
| Pennsylvania | 300 | 289 | 11 |
| Puerto Rico | 863 | 837 | 26 |
| Rhode Island | 25 | 25 | 0 |
| South Carolina | 135 | 128 | 7 |
| South Dakota | 25 | 23 | 2 |
| Tennessee | 176 | 170 | 6 |
| Texas | 628 | 628 | 0 |
| Utah | 46 | 46 | 0 |
| Vermont | 25 | 23 | 2 |
| Virgin Islands | 14 | 13 | 1 |
| Virginia | 212 | 207 | 5 |
| Washington | 139 | 132 | 7 |
| Washington DC | 25 | 25 | 0 |
| West Virginia | 55 | 52 | 3 |
| Wisconsin | 120 | 120 | 0 |
| Wyoming | 25 | 24 | 1 |
Map of Opportunity Zones
Opportunity Zones Map created by OpportunityZones.com
Opportunity Zones Analysis
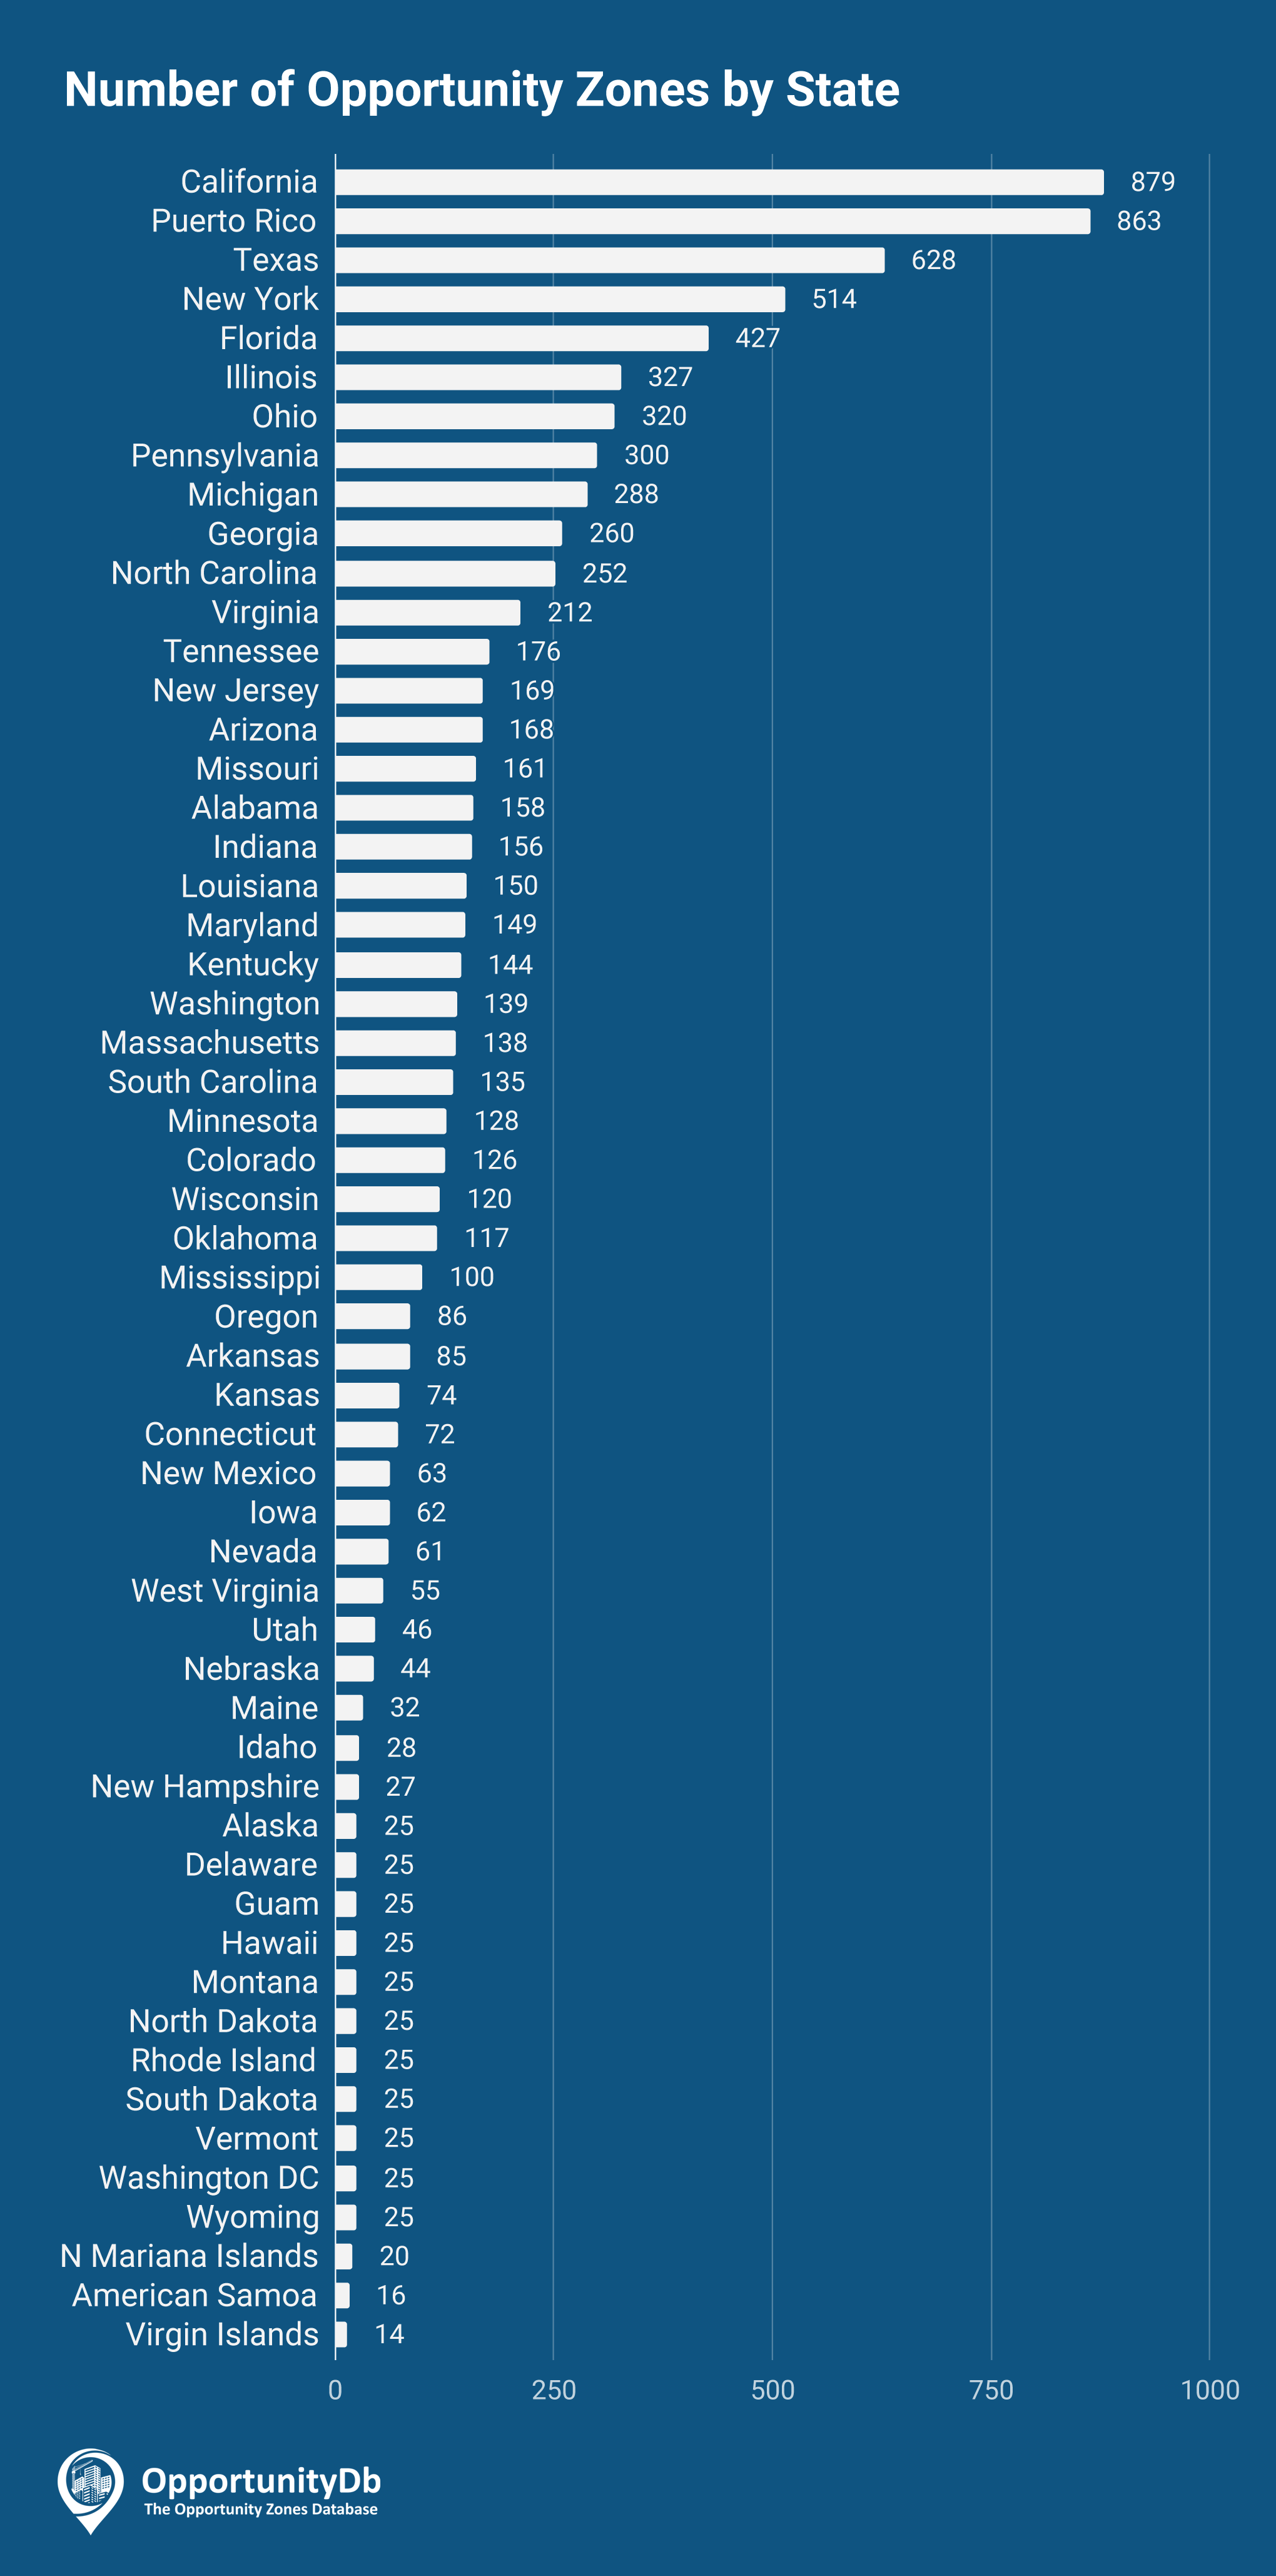
Number of Opportunity Zones
States and U.S. overseas possessions were able to designate up to 25 percent of eligible census tracts as opportunity zones. Therefore, the number of opportunity zones in each state is highly correlated with the total population of the state. This explains why California, Texas, New York, Florida, and Illinois are among the states with the most opportunity zones, together accounting for nearly one-third of the total.
Puerto Rico is the outlier; their count of 863 opportunity zones is second only to California’s 879. Because of the extensive hurricane damage from 2017, Puerto Rico was granted special status that allowed them to nominate all of their low-income census tracts as opportunity zones. As such, nearly every tract on the island is an opportunity zone.
States and overseas possessions with fewer than 100 eligible census tracts were able to nominate up to 25 opportunity zones. Alaska, Delaware, Guam, Hawaii, Montana, North Dakota, Rhode Island, South Dakota, Vermont, Washington DC, and Wyoming all took advantage of this rule, explaining why each of these locations has exactly 25 opportunity zones. Northern Mariana Islands, American Samoa, and Virgin Islands have fewer than 25 eligible tracts.
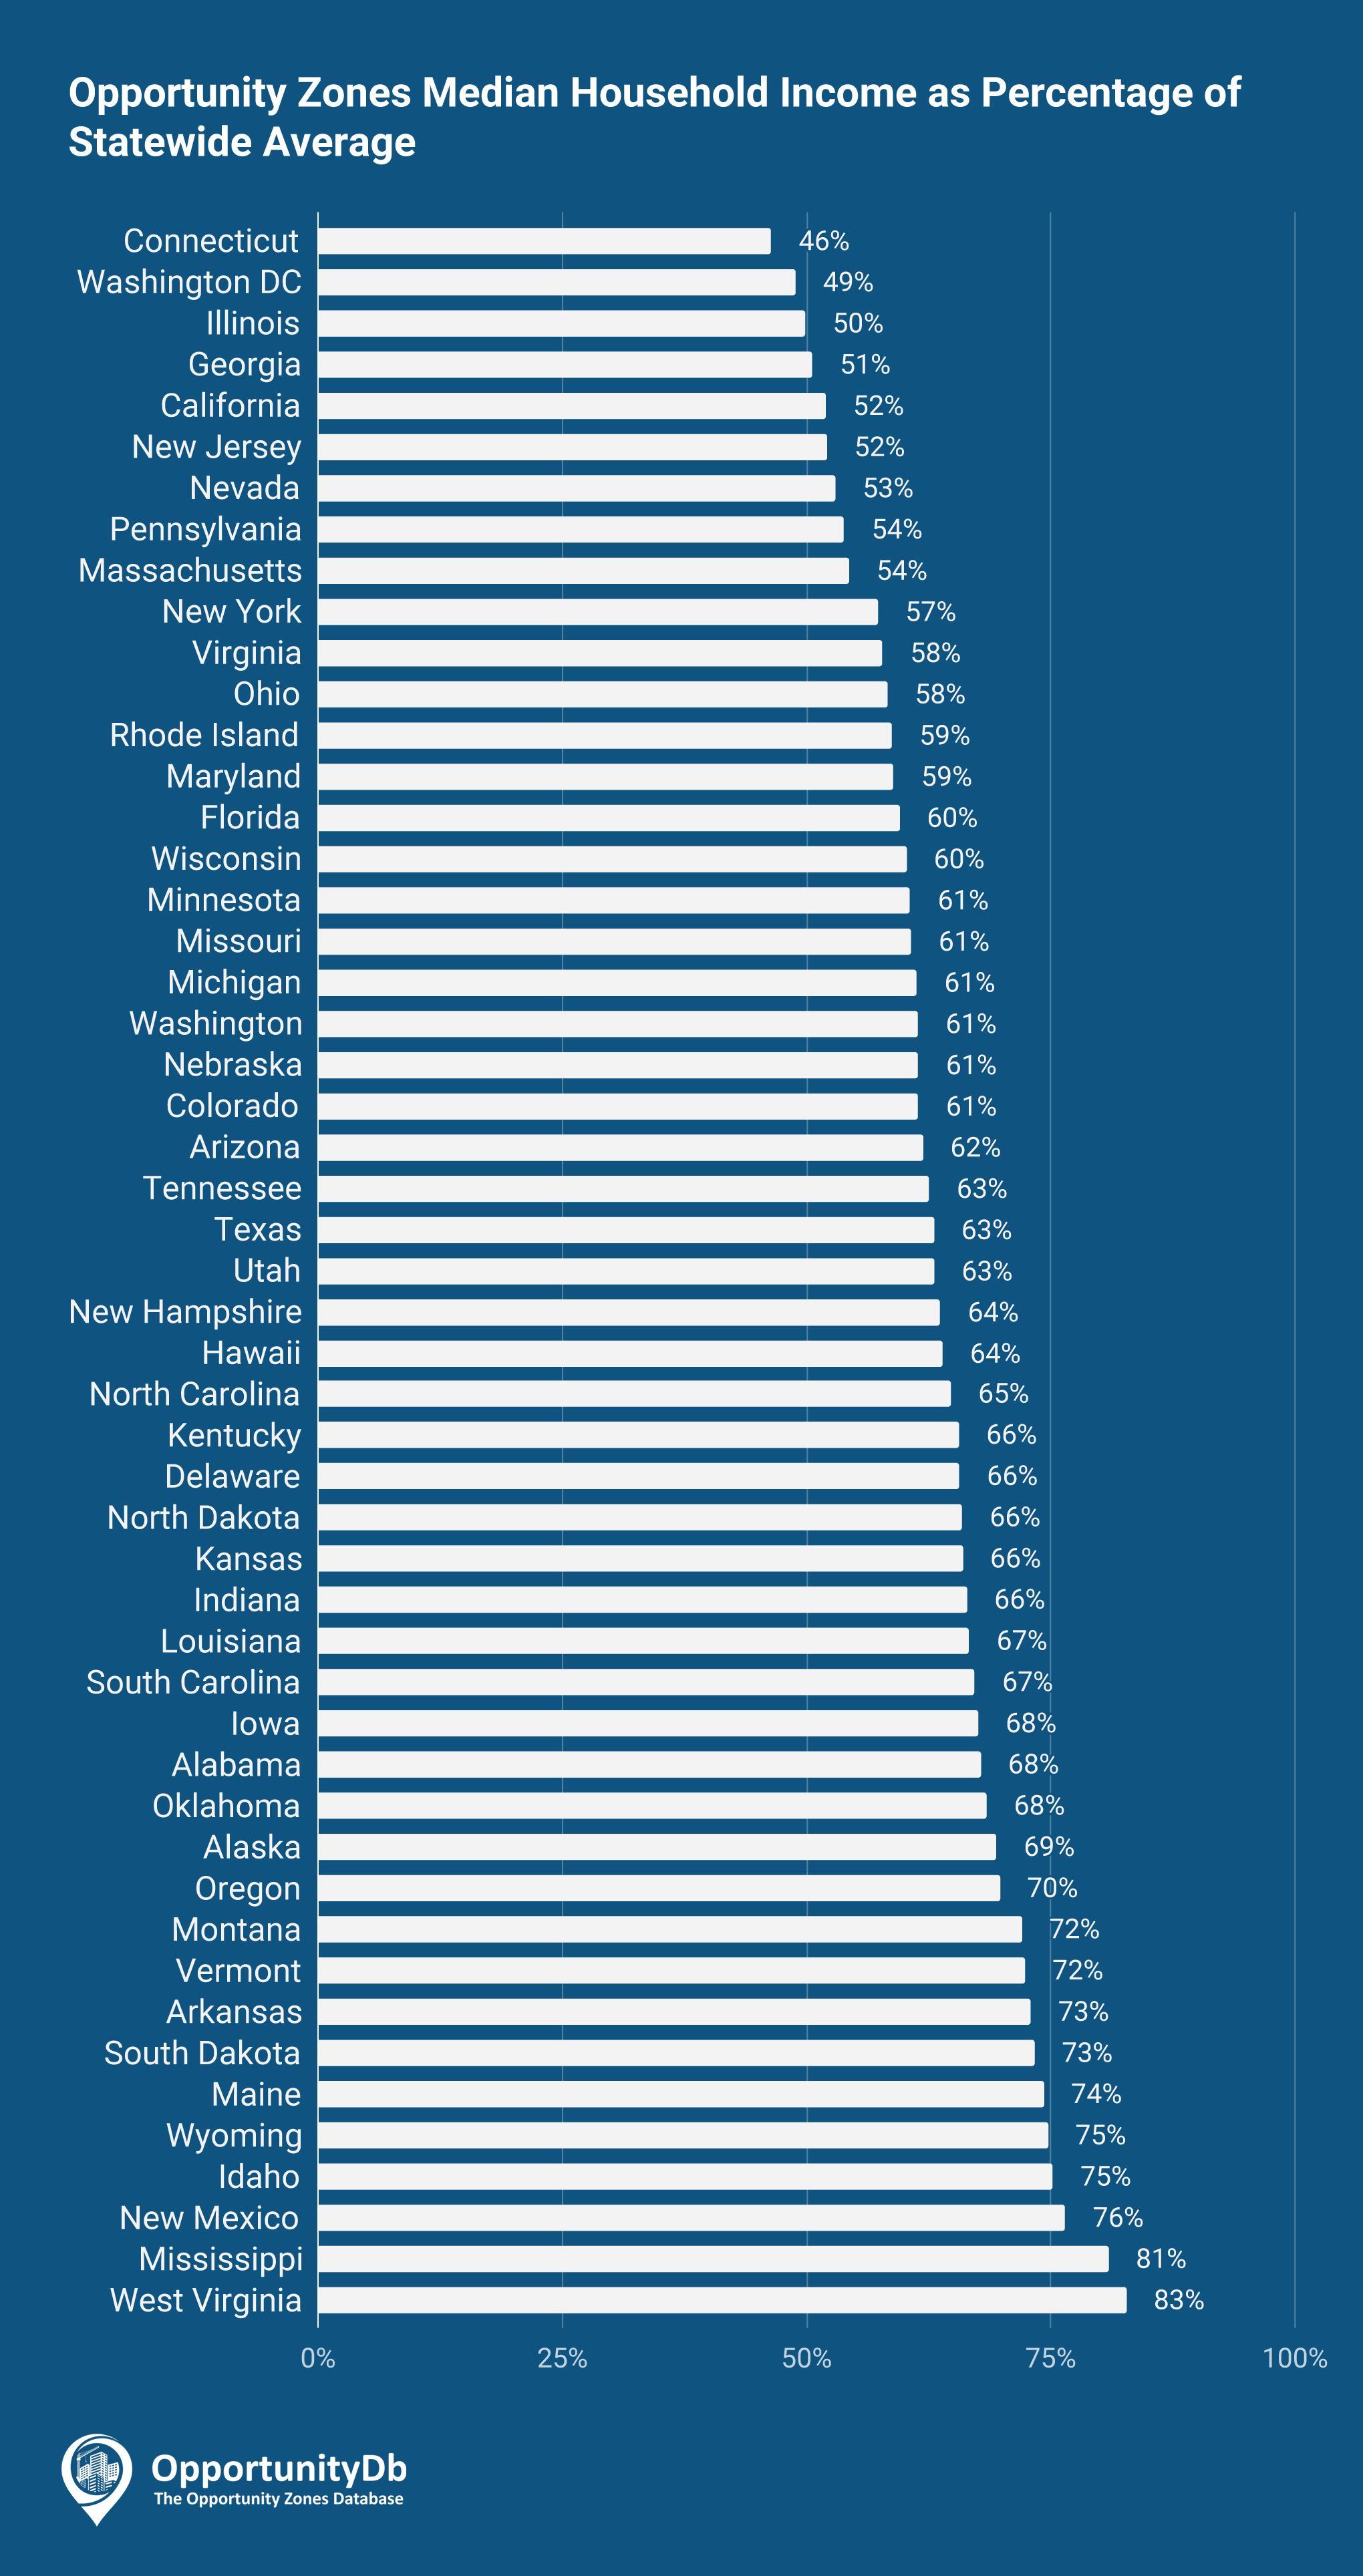
Median Household Income
Because only low-income census tracts and certain tracts contiguous with low-income tracts were eligible for opportunity zone nomination, the median household income of all of a state’s opportunity zones is always lower than the statewide average. Certain states have higher levels of income disparity between opportunity zones and their statewide average than others.
In places like Connecticut, Washington DC, and Illinois, the median household income in opportunity zones is 50 percent or less than the statewide average. Conversely, in places like New Mexico, Mississippi, and West Virginia, there is a much lower level of income disparity; median household income in the opportunity zones of these states is greater than 75 percent of the statewide average.
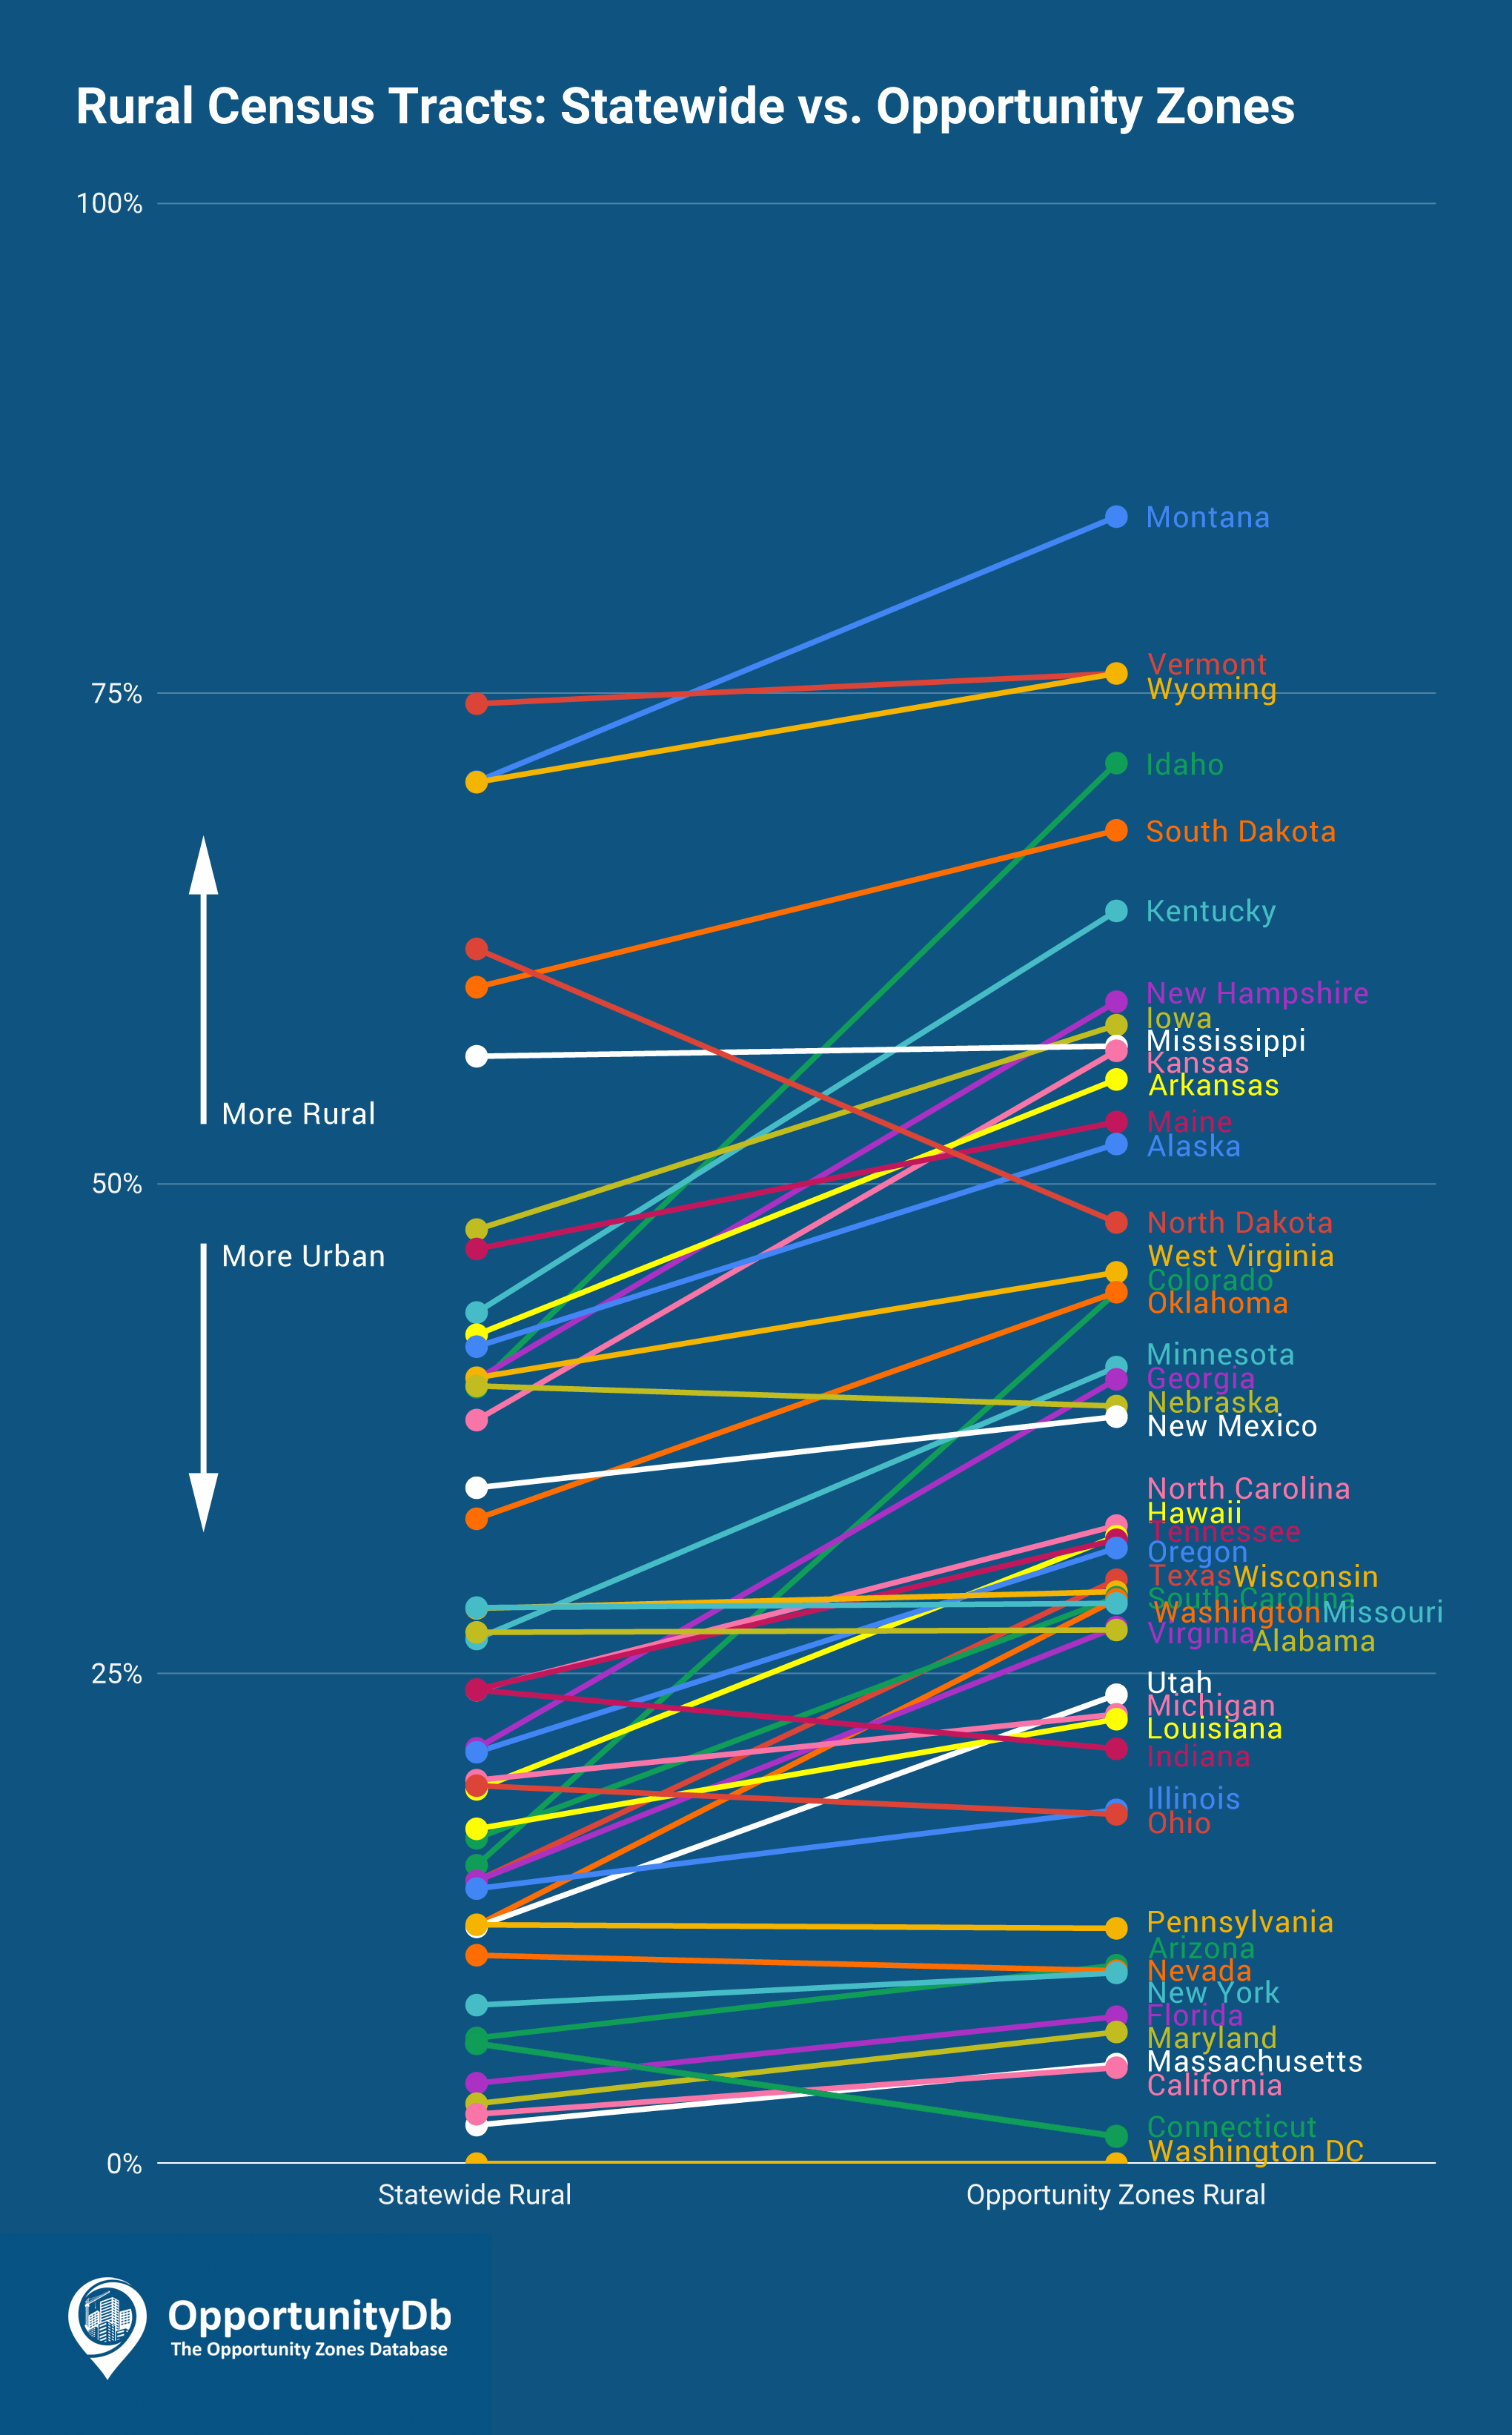
Rural vs. Urban
Some states are more rural than others. The slope of the lines in the chart below illustrate how some states focused on nominating opportunity zones from rural or urban areas of the state. While most states nominated a slightly higher percentage of rural opportunity zones vs. their statewide averages, there are some outliers.
States like Idaho, New Hampshire, Colorado, and Georgia focused on nominating rural areas as opportunity zones (large positive slope on the chart below). Other states like North Dakota, Indiana, Ohio, and Connecticut focused on nominating urban areas as opportunity zones (negative slope on the chart below).