Now Available: The Opportunity Zones Playbook
New Census Data Defines Opportunity Zone 2.0 Eligible Tracts
OpportunityZones.com analysis of the latest U.S. Census Bureau data indicates that 6,544 new Opportunity Zones would be designated in the OZ 2.0 cycle, assuming Treasury relies on the ACS data as published.
This analysis is based on the Census Bureau’s most recent five-year American Community Survey (ACS) estimates for the 2020–2024 period, released on January 29, 2026. This data provides the income and poverty metrics used to determine which census tracts are eligible to be nominated for Opportunity Zone designation in the upcoming OZ 2.0 round.
Each state, the District of Columbia, and the five inhabited U.S. territories will begin a 90- to 120-day OZ nomination period starting July 1, 2026, with new Opportunity Zone 2.0 designations taking effect on January 1, 2027.
Current Opportunity Zones vs. OZ 2.0 Eligible Tracts
Under federal law, Opportunity Zones are designated from among census tracts that meet specific low-income community criteria, subject to a statutory cap on the number of eligible tracts each state may designate. As a result, the number of census tracts that qualify as eligible is larger than the number of tracts that will ultimately be designated as Opportunity Zones.
Using the newly released 2020–2024 ACS data, the analysis below compares:
- The current number of Opportunity Zones designated in each state;
- The anticipated number of census tracts eligible for designation under OZ 2.0 in each state; and
- The anticipated number of Opportunity Zones that would be designated in each state during the upcoming OZ 2.0 designation round.
At the national level, the analysis shows a clear difference between the current Opportunity Zone footprint and the size of the forthcoming OZ 2.0 footprint. Nationally, the OZ 2.0 designation map would include 25.3% fewer Opportunity Zones than the original OZ 1.0 map. The difference varies substantially by state, as reflected in the summary table below.
State-by-State Eligibility Summary
| Jurisdiction | OZ 2.0 Eligible Tracts | Anticipated Number of OZ 2.0 Designated Tracts | Current Number of OZ 1.0 Designated Tracts | OZ 2.0 vs. 1.0 Designation Change |
|---|---|---|---|---|
| Alabama | 563 | 141 | 158 | –11% |
| Alaska | 32 | 25 | 25 | 0% |
| American Samoa | 16 | 16 | 16 | 0% |
| Arizona | 500 | 125 | 168 | –26% |
| Arkansas | 310 | 78 | 85 | –8% |
| California | 2,469 | 618 | 879 | –30% |
| Colorado | 360 | 90 | 126 | –29% |
| Connecticut | 243 | 61 | 72 | –15% |
| Delaware | 61 | 25 | 25 | 0% |
| District of Columbia | 66 | 25 | 25 | 0% |
| Florida | 1,360 | 340 | 427 | –20% |
| Georgia | 942 | 236 | 260 | –9% |
| Guam | 20 | 20 | 25 | –20% |
| Hawaii | 88 | 25 | 25 | 0% |
| Idaho | 80 | 25 | 28 | –11% |
| Illinois | 950 | 238 | 327 | –27% |
| Indiana | 501 | 126 | 156 | –19% |
| Iowa | 175 | 44 | 62 | –29% |
| Kansas | 210 | 53 | 74 | –28% |
| Kentucky | 545 | 137 | 144 | –5% |
| Louisiana | 620 | 155 | 150 | +3% |
| Maine | 78 | 25 | 32 | –22% |
| Maryland | 451 | 113 | 149 | –24% |
| Massachusetts | 410 | 103 | 138 | –25% |
| Michigan | 856 | 214 | 288 | –26% |
| Minnesota | 289 | 73 | 128 | –43% |
| Mississippi | 404 | 101 | 100 | +1% |
| Missouri | 523 | 131 | 161 | –19% |
| Montana | 58 | 25 | 25 | 0% |
| Nebraska | 112 | 28 | 44 | –36% |
| Nevada | 195 | 49 | 61 | –20% |
| New Hampshire | 53 | 25 | 27 | –7% |
| New Jersey | 516 | 129 | 169 | –24% |
| New Mexico | 257 | 65 | 63 | +3% |
| New York | 1,702 | 426 | 514 | –17% |
| North Carolina | 807 | 202 | 252 | –20% |
| North Dakota | 37 | 25 | 25 | 0% |
| Northern Mariana Islands | 19 | 19 | 20 | –5% |
| Ohio | 1,032 | 258 | 320 | –19% |
| Oklahoma | 413 | 104 | 117 | –11% |
| Oregon | 229 | 58 | 86 | –33% |
| Pennsylvania | 866 | 217 | 300 | –28% |
| Puerto Rico | 712 | 178 | 863 | –79% |
| Rhode Island | 55 | 25 | 25 | 0% |
| South Carolina | 445 | 112 | 135 | –17% |
| South Dakota | 52 | 25 | 25 | 0% |
| Tennessee | 507 | 127 | 176 | –28% |
| Texas | 2,420 | 605 | 628 | –4% |
| U.S. Virgin Islands | 18 | 18 | 14 | +29% |
| Utah | 147 | 37 | 46 | –20% |
| Vermont | 24 | 24 | 25 | –4% |
| Virginia | 607 | 152 | 212 | –28% |
| Washington | 394 | 99 | 139 | –29% |
| West Virginia | 207 | 52 | 55 | –5% |
| Wisconsin | 306 | 77 | 120 | –36% |
| Wyoming | 20 | 20 | 25 | –20% |
| Nationwide | 25,332 | 6,544 | 8,764 | –25.33% |
Key Takeaways
The state-by-state data reveals several clear patterns in how the OZ 2.0 designation landscape would differ from the current Opportunity Zone map.
- Large states see the biggest absolute reductions. States with the largest current Opportunity Zone footprints experience the most significant declines in the number of zones that could be designated under OZ 2.0. California (–261 zones), Illinois (–89), New York (–88), Florida (–87), Pennsylvania (–83), Michigan (–74), Ohio (–62), and Virginia (–60) all see substantial reductions in absolute terms.
- Puerto Rico experiences the sharpest decline. Puerto Rico would see its number of Opportunity Zones fall from 863 today to 178 under OZ 2.0, a reduction of 685 zones (–79%). This large drop is driven by the elimination of Puerto Rico’s special rule allowing it to designate all eligible tracts in the original round.
- Most states experience percentage declines in the 20–30% range. Across much of the country, the reduction in Opportunity Zones is meaningful but not uniform. Many large and mid-sized states cluster around 20–30% fewer zones than under the original designations.
- States with small populations remain largely unchanged. States and jurisdictions with fewer than 100 eligible tracts—such as Alaska, Delaware, Hawaii, Montana, Rhode Island, South Dakota, and the District of Columbia—would retain approximately the same number of Opportunity Zones due to the statutory minimum of 25 zones.
- Only a handful of jurisdictions see modest gains. A small number of states would see slight increases in the number of Opportunity Zones, including Louisiana (+5), the U.S. Virgin Islands (+4), New Mexico (+2), and Mississippi (+1). These gains are relatively modest in both absolute and percentage terms.
What This Means for States
With tract eligibility now defined by the latest ACS data, states can see—well in advance of the nomination window opening on July 1, 2026—how much flexibility they will have in the OZ 2.0 designation process. States with large reductions in eligible tracts will face tighter tradeoffs in selecting zones, while those with stable or expanding eligibility pools will retain greater discretion.
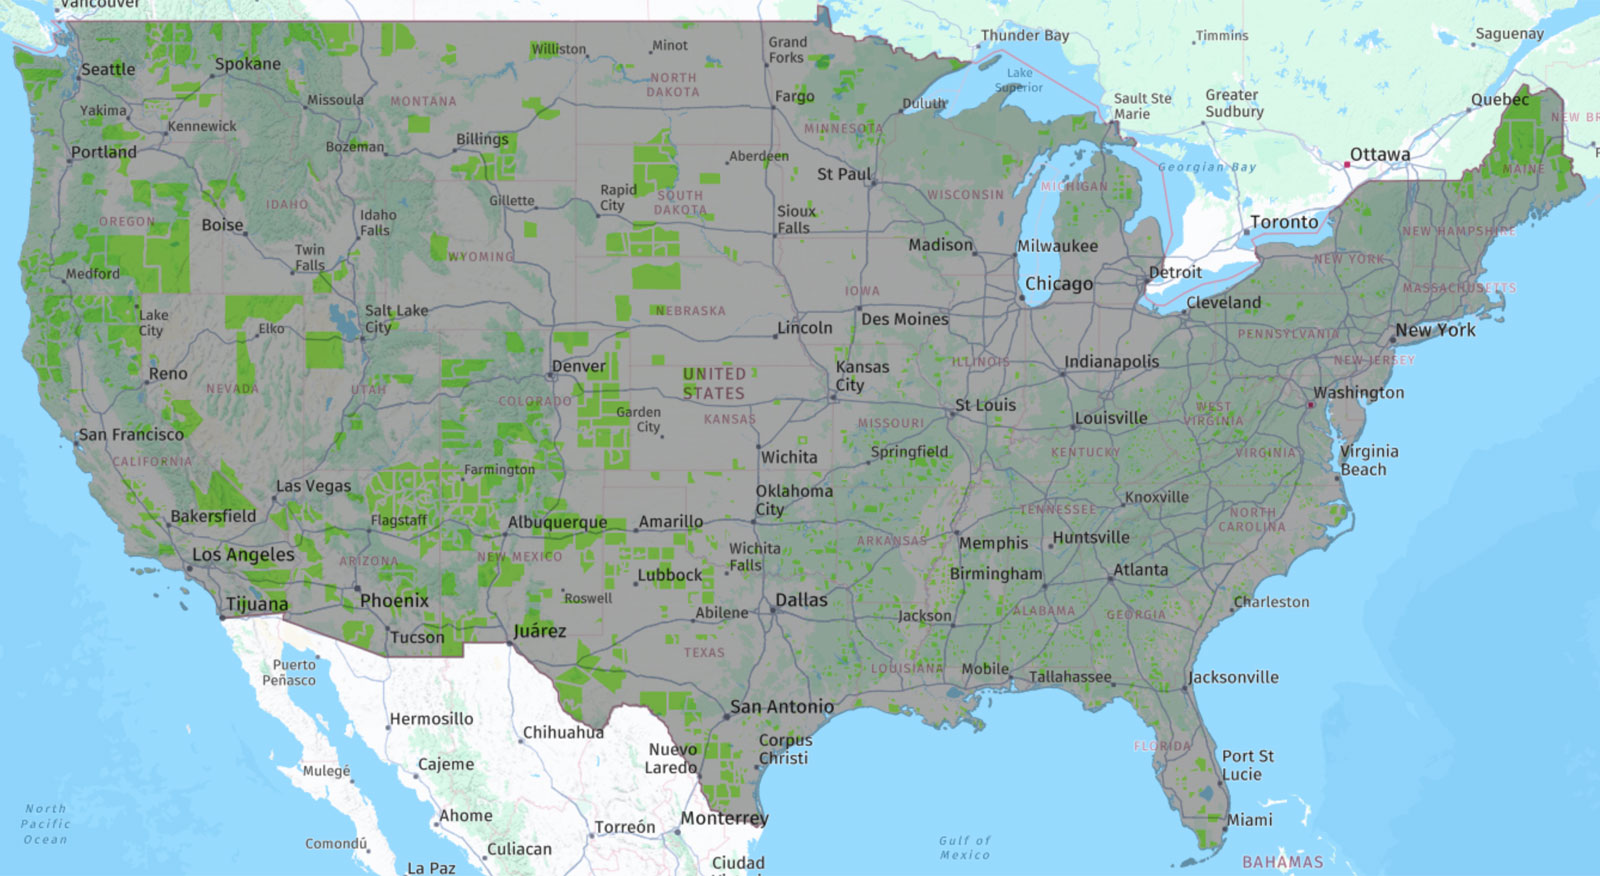
The OZ 2.0 Eligibility Map
To illustrate how eligibility is distributed geographically, an interactive OZ 2.0 eligibility map shows census tracts that qualify for Opportunity Zone designation based on the 2020–2024 ACS data. Green shaded regions represent OZ 2.0 eligible tracts, while gray shaded regions do not qualify.
Download the OZ 2.0 Eligibility Data
The full state-by-state and tract-level eligibility dataset used in this analysis is available for download:
- Google Sheets: Open in Google Sheets
- Excel: Download the Excel version (.xlsx)
This spreadsheet includes the underlying eligibility calculations based on the 2020–2024 ACS five-year estimates and may be used for independent analysis or mapping.
Disclosure: This Is Not the Official Eligibility List
While this analysis identifies census tracts that meet the statutory eligibility criteria for Opportunity Zone designation based on the newly released 2020–2024 ACS data, it does not constitute an official eligibility list.
The U.S. Department of the Treasury is responsible for determining and publishing the official list of eligible census tracts for the upcoming Opportunity Zone 2.0 designation round. Treasury is expected to release that official eligibility list at a later date, likely in February 2026.
Until Treasury publishes its official list, all eligibility determinations should be considered analytical and informational in nature. While this analysis applies the statutory criteria using the most recent Census Bureau data, the official list released by Treasury will control for purposes of state nominations and final Opportunity Zone designations.
About the American Community Survey
The American Community Survey (ACS) is an ongoing nationwide survey conducted by the U.S. Census Bureau that provides the demographic and economic data used to determine Opportunity Zone tract eligibility.
Unlike the decennial census, which is conducted once every 10 years, the ACS supplies the data used to measure community-level conditions such as median income and poverty rates, with five-year estimates offering the most statistically reliable data for small geographies like census tracts.
With the release of the 2020–2024 ACS five-year estimates, the full universe of census tracts that meet the statutory eligibility requirements for Opportunity Zone designation can now be identified on a national and state-by-state basis, setting the baseline for the next round of Opportunity Zone designations under OZ 2.0.
Methodology
This analysis estimates the number of census tracts eligible for Opportunity Zone (OZ) designation—and the number that could ultimately be designated—in the upcoming Opportunity Zone 2.0 designation round, using the most recent demographic data available.
Data Sources
- 2020–2024 American Community Survey (ACS) 5-Year Estimates from the U.S. Census Bureau provided tract-level data on poverty rates and median family income.
- OMB Metropolitan Statistical Area (MSA) delineation files were used to distinguish between metropolitan and non-metropolitan census tracts and to determine applicable income thresholds.
- 2020 Decennial Census of Island Areas (DECIA) data was used to determine tract eligibility for American Samoa, Guam, the Commonwealth of the Northern Mariana Islands, and the U.S. Virgin Islands. The DECIA is a specialized component of the decennial census program conducted every 10 years to provide demographic and economic information for U.S. territories where ACS data is not available.
Eligibility Calculations
Census tracts were evaluated for Opportunity Zone eligibility under the statutory low-income community criteria applicable to the OZ 2.0 designation round.
Under current law, as amended by the One Big Beautiful Bill Act of 2025, a census tract is defined as a low-income community and qualifies for Opportunity Zone designation if it meets either of the following tests:
Test 1: Income-only Test: The tract has a median family income that does not exceed 70% of the statewide median family income (for non-metropolitan tracts), or 70% of the metropolitan area’s median family income (for metropolitan tracts).
Test 2: Poverty + income test: The tract has a poverty rate of at least 20%, AND the tract has a median family income that does not exceed 125% of the statewide median family income (for non-metropolitan tracts) or 125% of the metropolitan area median family income (for metropolitan tracts).
Note: The “non-low-income contiguous tract” provision available in OZ 1.0 has been eliminated. Every tract must now qualify on its own merits under one of these two tests.
Statutory Designation Limits
Federal law limits the number of Opportunity Zones that may be designated to no more than 25% of eligible census tracts in each jurisdiction.
- States with fewer than 100 eligible tracts may designate up to 25 Opportunity Zones.
- States with fewer than 25 eligible tracts may designate all eligible tracts as Opportunity Zones.
- The special rule that allowed Puerto Rico to designate all eligible tracts as Opportunity Zones under OZ 1.0 has been eliminated under OZ 2.0.
These statutory caps were applied on a state-by-state basis to estimate the number of Opportunity Zones that could be designated in the upcoming OZ 2.0 round.
Consistent with IRS administrative guidance, fractional results under the 25 percent cap—where the eligible tract count was not evenly divisible by 4—were rounded up to the next whole number, following the approach outlined in Revenue Procedure 2018-16 issued by the Internal Revenue Service.
Analytical Approach
- All ACS data was downloaded from data.census.gov.
- All calculations were performed in Google Sheets, including poverty rate evaluations, income threshold comparisons, and metropolitan status classification.
- Each census tract was classified as eligible or ineligible for Opportunity Zone designation based on the criteria above.
- Statutory caps were applied to estimate the number of Opportunity Zones that could be designated in each state.
Limitations
- This analysis is based on the most recent ACS five-year estimates and DECIA data available at the time of publication.
- Actual Opportunity Zone designations may differ based on state nomination decisions, administrative discretion, and other factors not modeled here.
A correction was made on February 6, 2026: An earlier version of this analysis misinterpreted how the statutory 25 percent cap is applied in states where the number of eligible census tracts is not divisible by four. Our initial analysis rounded fractional results down. However, IRS guidance issued in 2018 indicates that the cap should be applied by rounding up to the next whole number. This correction affects 28 states and results in 28 additional census tracts that we now expect to be designated in the OZ 2.0 cycle.
🎩 Hat tip to Kenan Fikri from the Economic Innovation Group for pointing this out!