OZ Pitch Day - July 30, 2026
Opportunity Zones by State: Current and Future Designations
A total of 8,764 Qualified Opportunity Zones are currently designated nationwide. A subsequent designation round under Opportunity Zones 2.0 will be completed in the second half of 2026. Based on current statutory eligibility criteria and OpportunityZones.com analysis of the latest Census Bureau data, this new round is projected to yield approximately 6,544 additional designations, with those designations going into effect on January 1, 2027.
The table below summarizes current and future Opportunity Zone designations by jurisdiction.
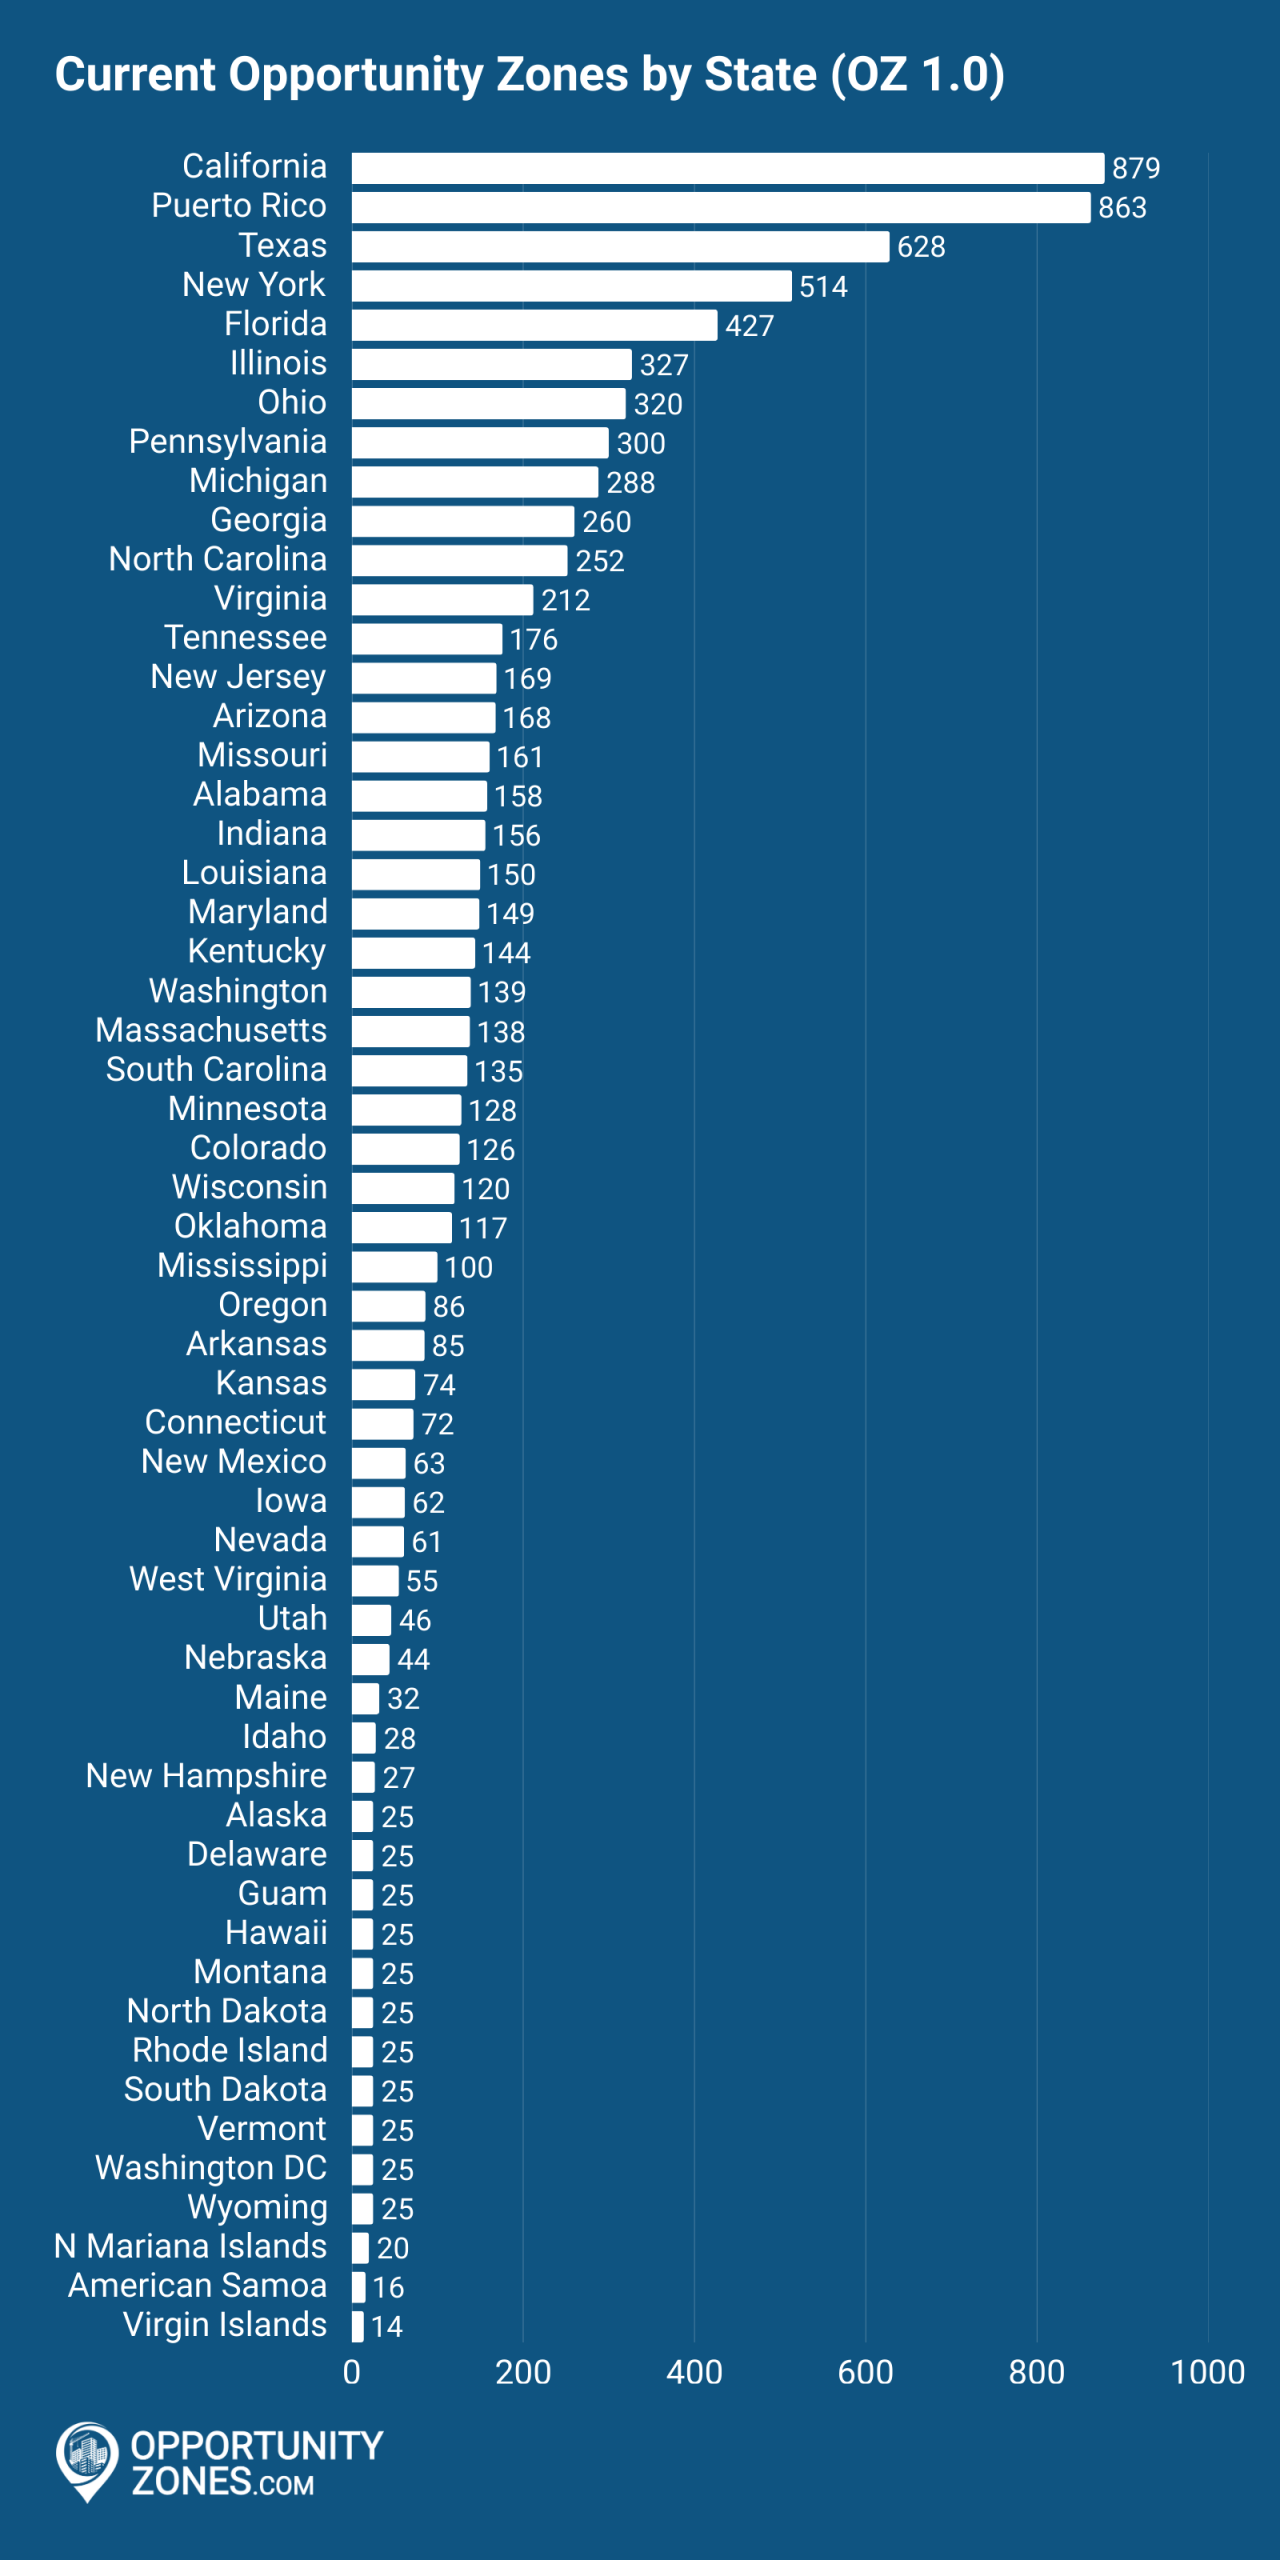
- OZ 1.0: Current designations (in effect 2018–2028).
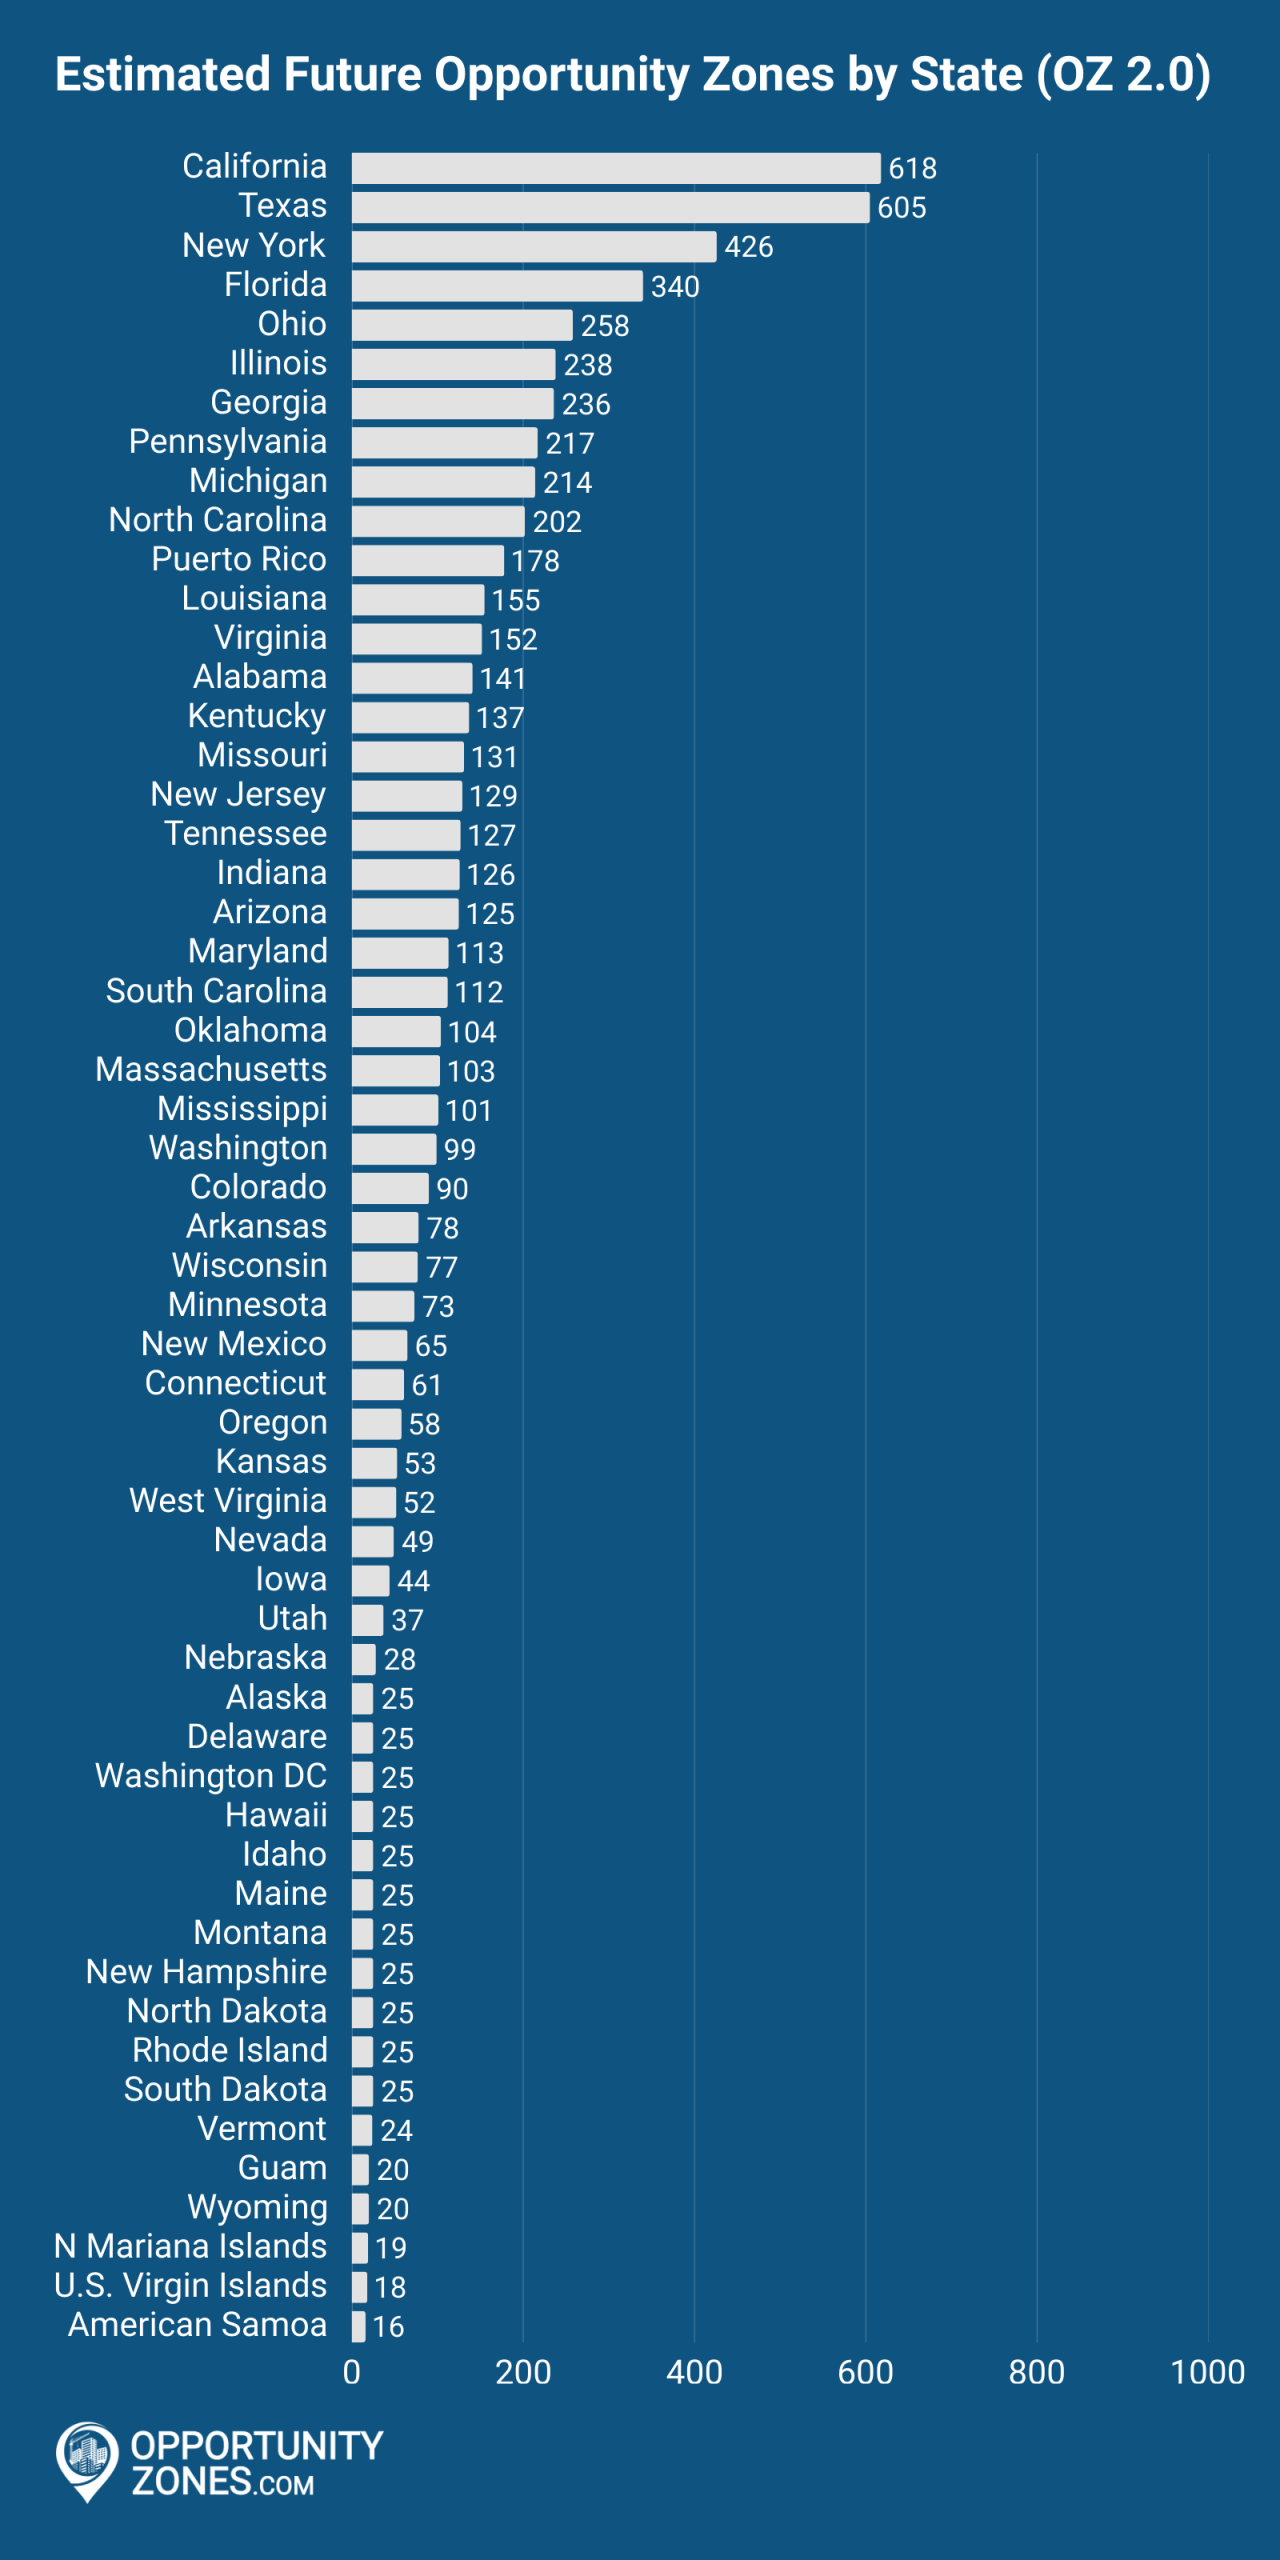
- OZ 2.0: Anticipated designations in the 2026 nomination round.
| Jurisdiction | OZ 1.0 | OZ 2.0* |
|---|---|---|
| Alabama | 158 | 141 |
| Alaska | 25 | 25 |
| American Samoa | 16 | 16 |
| Arizona | 168 | 125 |
| Arkansas | 85 | 78 |
| California | 879 | 618 |
| Colorado | 126 | 90 |
| Connecticut | 72 | 61 |
| Delaware | 25 | 25 |
| District of Columbia | 25 | 25 |
| Florida | 427 | 340 |
| Georgia | 260 | 236 |
| Guam | 25 | 20 |
| Hawaii | 25 | 25 |
| Idaho | 28 | 25 |
| Illinois | 327 | 238 |
| Indiana | 156 | 126 |
| Iowa | 62 | 44 |
| Kansas | 74 | 53 |
| Kentucky | 144 | 137 |
| Louisiana | 150 | 155 |
| Maine | 32 | 25 |
| Maryland | 149 | 113 |
| Massachusetts | 138 | 103 |
| Michigan | 288 | 214 |
| Minnesota | 128 | 73 |
| Mississippi | 100 | 101 |
| Missouri | 161 | 131 |
| Montana | 25 | 25 |
| Nebraska | 44 | 28 |
| Nevada | 61 | 49 |
| New Hampshire | 27 | 25 |
| New Jersey | 169 | 129 |
| New Mexico | 63 | 65 |
| New York | 514 | 426 |
| North Carolina | 252 | 202 |
| North Dakota | 25 | 25 |
| Northern Mariana Islands | 20 | 19 |
| Ohio | 320 | 258 |
| Oklahoma | 117 | 104 |
| Oregon | 86 | 58 |
| Pennsylvania | 300 | 217 |
| Puerto Rico | 863 | 178 |
| Rhode Island | 25 | 25 |
| South Carolina | 135 | 112 |
| South Dakota | 25 | 25 |
| Tennessee | 176 | 127 |
| Texas | 628 | 605 |
| U.S. Virgin Islands | 14 | 18 |
| Utah | 46 | 37 |
| Vermont | 25 | 24 |
| Virginia | 212 | 152 |
| Washington | 139 | 99 |
| West Virginia | 55 | 52 |
| Wisconsin | 120 | 77 |
| Wyoming | 25 | 20 |
| Nationwide | 8,764 | 6,544 |
* Note: OZ 2.0 zone designation counts reflect anticipated number of designations based on OpportunityZones.com analysis of 2020–2024 ACS data and current statutory criteria. Final Opportunity Zone designations will be determined through a future Treasury and state nomination process that will unfold in the second half of 2026.
See also: Opportunity Zones in Major U.S. Cities
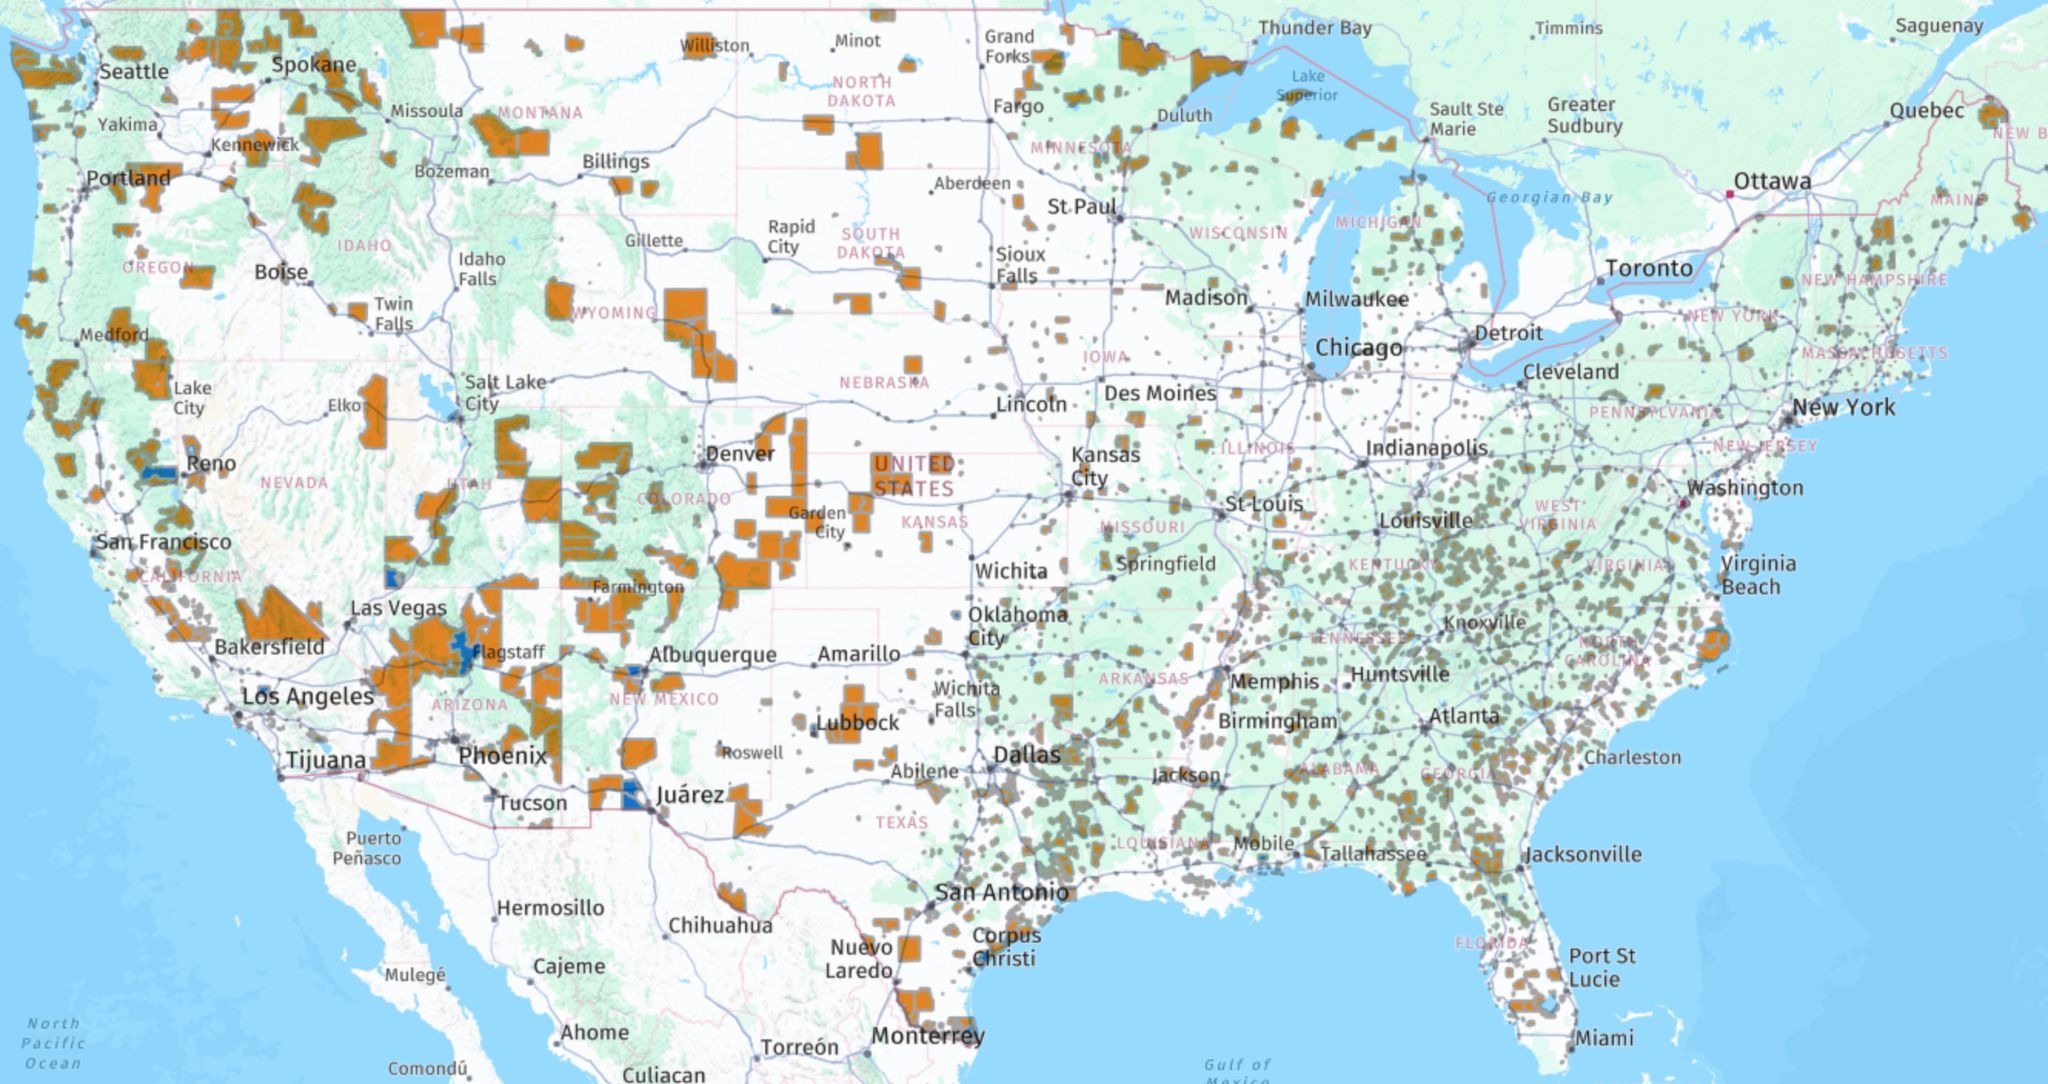
Map of Opportunity Zones
Click the image below to use our interactive Opportunity Zones map.
How OZ 1.0 Designations Were Allocated
Under the original OZ 1.0 Opportunity Zone designation framework established by the Tax Cuts and Jobs Act of 2017, each state, the District of Columbia, and the five inhabited U.S. territories were permitted to designate up to 25 percent of eligible low-income census tracts as Opportunity Zones in early 2018.
As a result, the total number of designated zones in each jurisdiction closely tracks population size and the number of eligible tracts. This dynamic explains why large states such as California, Texas, New York, Florida, and Illinois account for a disproportionate share of all Opportunity Zones, collectively comprising nearly one-third of the national total.
Puerto Rico represents a notable exception. Following widespread hurricane damage in 2017, Puerto Rico was granted a special designation rule under which all eligible low-income census tracts were automatically designated as Opportunity Zones in 2018. Consequently, Puerto Rico has 863 Opportunity Zones (second only to California’s 879), and nearly the entire island falls within an Opportunity Zone.
Jurisdictions with fewer than 100 eligible census tracts were subject to a separate rule permitting the designation of up to 25 Opportunity Zones, regardless of the 25 percent cap. Alaska, Delaware, Guam, Hawaii, Montana, North Dakota, Rhode Island, South Dakota, Vermont, Washington DC, and Wyoming each designated the maximum number under this provision, resulting in exactly 25 Opportunity Zones in each jurisdiction. The Northern Mariana Islands, American Samoa, and the U.S. Virgin Islands have fewer than 25 eligible census tracts and therefore designated fewer Opportunity Zones.
With the OZ 1.0 framework expiring at the end of 2026 (and the OZ 1.0 tracts themselves expiring at the end of 2028), federal law now provides for OZ 2.0 nominations, explained below.
How OZ 2.0 Designations Will Be Determined
Under the OZ 2.0 Opportunity Zone designation framework established by the One Big Beautiful Bill Act of 2025, a new nomination process will take place in the second half of 2026, with designations taking effect on January 1, 2027.
As with the original program, states, the District of Columbia, and the five inhabited U.S. territories will nominate eligible census tracts for certification by the U.S. Department of the Treasury. Eligibility for the OZ 2.0 designation round is based on updated economic and demographic data from the U.S. Census Bureau’s 2020–2024 five-year American Community Survey (ACS).
Under current law, a census tract is eligible for OZ 2.0 designation if it meets revised low-income community criteria based on poverty rates and median family income. Unlike the original OZ 1.0 framework, eligibility is determined strictly on a tract-by-tract basis, without a contiguous-tract provision. As before, jurisdictions may designate no more than 25 percent of eligible tracts, subject to an exception for jurisdictions with less than 100 eligible census tracts.
Based on current eligibility estimates, the total number of OZ 2.0 designations nationwide is expected to be smaller than the existing OZ 1.0 footprint. Additional detail on OZ 2.0 eligibility and projected tract counts, including state-by-state analysis based on the 2020–2024 ACS data, is available in OpportunityZones.com’s OZ 2.0 eligibility analysis.
Final eligibility lists and designations will be determined by the U.S. Department of the Treasury following the 2026 nomination process.
Major U.S. Cities with Opportunity Zones
There are over 3,000 U.S. cities with at least one Opportunity Zone. Here is a list of the major cities with Opportunity Zones.
- Atlanta Opportunity Zones
- Austin Opportunity Zones
- Charlotte Opportunity Zones
- Chicago Opportunity Zones
- Cincinnati Opportunity Zones
- Cleveland Opportunity Zones
- Columbus Opportunity Zones
- Dallas Opportunity Zones
- Detroit Opportunity Zones
- Fort Worth Opportunity Zones
- Houston Opportunity Zones
- Indianapolis Opportunity Zones
- Jacksonville Opportunity Zones
- Las Vegas Opportunity Zones
- Los Angeles Opportunity Zones
- Memphis Opportunity Zones
- Miami Opportunity Zones
- Nashville Opportunity Zones
- New York Opportunity Zones
- Oklahoma City Opportunity Zones
- Orlando Opportunity Zones
- Philadelphia Opportunity Zones
- Phoenix Opportunity Zones
- Portland Opportunity Zones
- San Antonio Opportunity Zones
- San Diego Opportunity Zones
- San Francisco Opportunity Zones
- San Jose Opportunity Zones
- Seattle Opportunity Zones
- Tucson Opportunity Zones
- Tulsa Opportunity Zones